Money
Visualizing the Top Countries by Wealth per Person
Visualizing the Top Countries by Wealth per Person
When looking at wealth per person on a country-by-country basis, is it more important to look at median wealth or average wealth?
Many experts believe that median wealth provides the most accurate picture of wealth since it identifies the middle point of a dataset, with half of the data points above this number, and half falling below it. In this way, it is less impacted by extreme values, and gives a good representation of the “middle of the pack”.
With that said, average wealth gives you a true average, even though it may get distorted by outliers, like the fortunes held by billionaires.
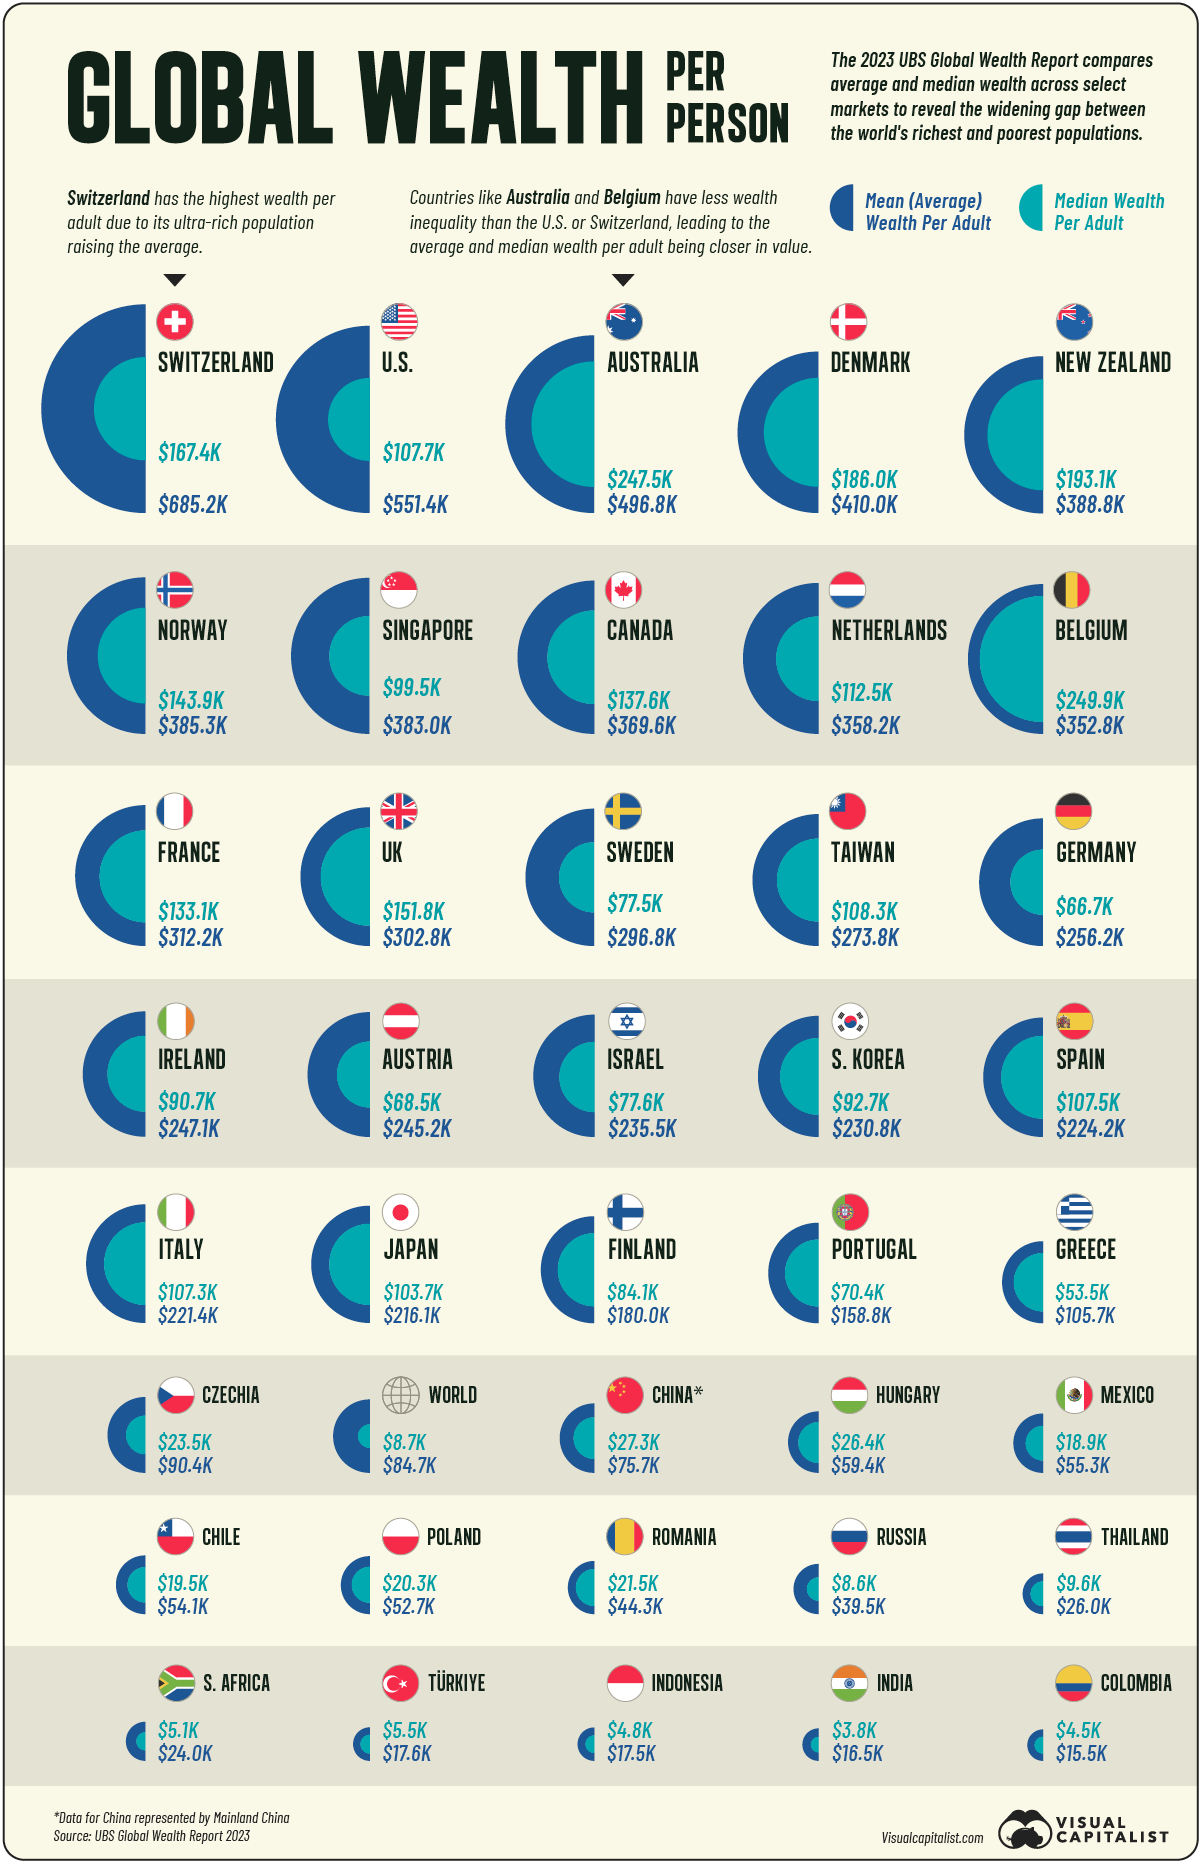
Either way, today’s graphic compares both average and median wealth across select countries, using data from the 2023 UBS Global Wealth Report.
Top Countries by Average Wealth per Person
In 2022, global average wealth per adult stood at $84,718.
By these measures, Switzerland ranks at the top at $685,226 per person. Over 15% of the population are millionaires, the third-highest rate in the world. However, when looking at median wealth per person, it stands at $167,353, a difference of over $517,000.
Like Switzerland, five of the top 10 countries by average wealth are in Western Europe, including Denmark, Norway, the Netherlands, and Belgium.
The table below shows average wealth per adult in 2022 across 39 countries analyzed by UBS:
| Rank | Country | Mean Wealth per Adult |
|---|---|---|
| 1 | 🇨🇭 Switzerland | $685,226 |
| 2 | 🇺🇸 U.S. | $551,347 |
| 3 | 🇦🇺 Australia | $496,819 |
| 4 | 🇩🇰 Denmark | $409,954 |
| 5 | 🇳🇿 New Zealand | $388,761 |
| 6 | 🇳🇴 Norway | $385,338 |
| 7 | 🇸🇬 Singapore | $382,957 |
| 8 | 🇨🇦 Canada | $369,577 |
| 9 | 🇳🇱 Netherlands | $358,235 |
| 10 | 🇧🇪 Belgium | $352,814 |
| 11 | 🇫🇷 France | $312,235 |
| 12 | 🇬🇧 UK | $302,783 |
| 13 | 🇸🇪 Sweden | $296,800 |
| 14 | 🇹🇼 Taiwan | $273,788 |
| 15 | 🇩🇪 Germany | $256,179 |
| 16 | 🇮🇪 Ireland | $247,080 |
| 17 | 🇦🇹 Austria | $245,225 |
| 18 | 🇮🇱 Israel | $235,445 |
| 19 | 🇰🇷 South Korea | $230,760 |
| 20 | 🇪🇸 Spain | $224,209 |
| 21 | 🇮🇹 Italy | $221,370 |
| 22 | 🇯🇵 Japan | $216,078 |
| 23 | 🇫🇮 Finland | $179,986 |
| 24 | 🇵🇹 Portugal | $158,840 |
| 25 | 🇬🇷 Greece | $105,724 |
| 26 | 🇨🇿 Czechia | $90,393 |
| 27 | 🇨🇳 China | $75,731 |
| 28 | 🇭🇺 Hungary | $59,348 |
| 29 | 🇲🇽 Mexico | $55,274 |
| 30 | 🇨🇱 Chile | $54,082 |
| 31 | 🇵🇱 Poland | $52,741 |
| 32 | 🇷🇴 Romania | $44,320 |
| 33 | 🇷🇺 Russia | $39,514 |
| 34 | 🇹🇭 Thailand | $25,956 |
| 35 | 🇿🇦 South Africa | $23,956 |
| 36 | 🇹🇷 Türkiye | $17,578 |
| 37 | 🇮🇩 Indonesia | $17,457 |
| 38 | 🇮🇳 India | $16,500 |
| 39 | 🇨🇴 Colombia | $15,464 |
| World | $84,718 |
The U.S. falls second, with a mean wealth per adult of $551,347.
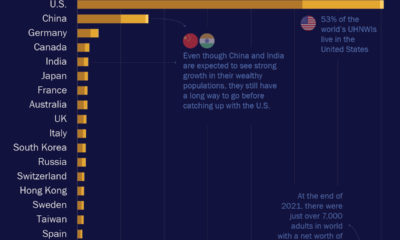
Overall, it is home to 38% of global millionaires, outpacing the second-highest country, China, by more than three times. With a significant wealth gap, income inequality in the U.S. is among the highest across developed nations.
Ranking seventh is Singapore, with the highest average wealth per adult across Asia. Income inequality in Singapore falls at a similar level to America based on its Gini ratio.
Top Countries by Median Wealth per Person
Here’s how wealth shifts when looking from a median wealth per adult basis:
| Rank | Country | Median Wealth per Adult |
|---|---|---|
| 1 | 🇧🇪 Belgium | $249,937 |
| 2 | 🇦🇺 Australia | $247,453 |
| 3 | 🇳🇿 New Zealand | $193,065 |
| 4 | 🇩🇰 Denmark | $186,041 |
| 5 | 🇨🇭 Switzerland | $167,353 |
| 6 | 🇬🇧 UK | $151,825 |
| 7 | 🇳🇴 Norway | $143,887 |
| 8 | 🇨🇦 Canada | $137,633 |
| 9 | 🇫🇷 France | $133,137 |
| 10 | 🇳🇱 Netherlands | $112,450 |
| 11 | 🇹🇼 Taiwan | $108,247 |
| 12 | 🇺🇸 U.S. | $107,739 |
| 13 | 🇪🇸 Spain | $107,507 |
| 14 | 🇮🇹 Italy | $107,315 |
| 15 | 🇯🇵 Japan | $103,681 |
| 16 | 🇸🇬 Singapore | $99,488 |
| 17 | 🇰🇷 South Korea | $92,719 |
| 18 | 🇮🇪 Ireland | $90,741 |
| 19 | 🇫🇮 Finland | $84,093 |
| 20 | 🇮🇱 Israel | $77,604 |
| 21 | 🇸🇪 Sweden | $77,515 |
| 22 | 🇵🇹 Portugal | $70,409 |
| 23 | 🇦🇹 Austria | $68,492 |
| 24 | 🇩🇪 Germany | $66,735 |
| 25 | 🇬🇷 Greece | $53,501 |
| 26 | 🇨🇳 China | $27,273 |
| 27 | 🇭🇺 Hungary | $26,416 |
| 28 | 🇨🇿 Czechia | $23,502 |
| 29 | 🇷🇴 Romania | $21,545 |
| 30 | 🇵🇱 Poland | $20,263 |
| 31 | 🇨🇱 Chile | $19,544 |
| 32 | 🇲🇽 Mexico | $18,920 |
| 33 | 🇹🇭 Thailand | $9,602 |
| 34 | 🇷🇺 Russia | $8,595 |
| 35 | 🇹🇷 Türkiye | $5,488 |
| 36 | 🇿🇦 South Africa | $5,141 |
| 37 | 🇮🇩 Indonesia | $4,819 |
| 38 | 🇨🇴 Colombia | $4,450 |
| 39 | 🇮🇳 India | $3,755 |
| World | $8,654 |
Belgium ranks the highest, climbing past Australia for the first time. High home ownership levels and elevated home prices have led household wealth to rise above other European countries.
Median wealth in the U.S. stood at $107,739, falling in 12th place.
Overall, median wealth has grown the fastest in China, increasing eightfold since 2000 to reach $27,273. The country’s rapid economic growth has lifted many into the middle class, yet wealth inequality has also increased.
Biggest Gaps in Average and Median Wealth
Which countries have the starkest difference between average and median wealth per adult?
Across the dataset, the U.S. saw the steepest gap. Median wealth per adult was $107,739—80.5% lower than average wealth levels. This means that wealth ownership skews disproportionately to the country’s richest.
Following the U.S. were South Africa, Russia, and India for illustrating the widest disparities between average and median wealth.
On the other end of the spectrum was Belgium, where median wealth per adult was the closest to average wealth levels. In this way, median wealth per person was $249,937 while average wealth was $352,814, reflecting less disparity.
Other countries with narrower gaps between median and average wealth per person included Greece, the UK, and Australia.


Markets
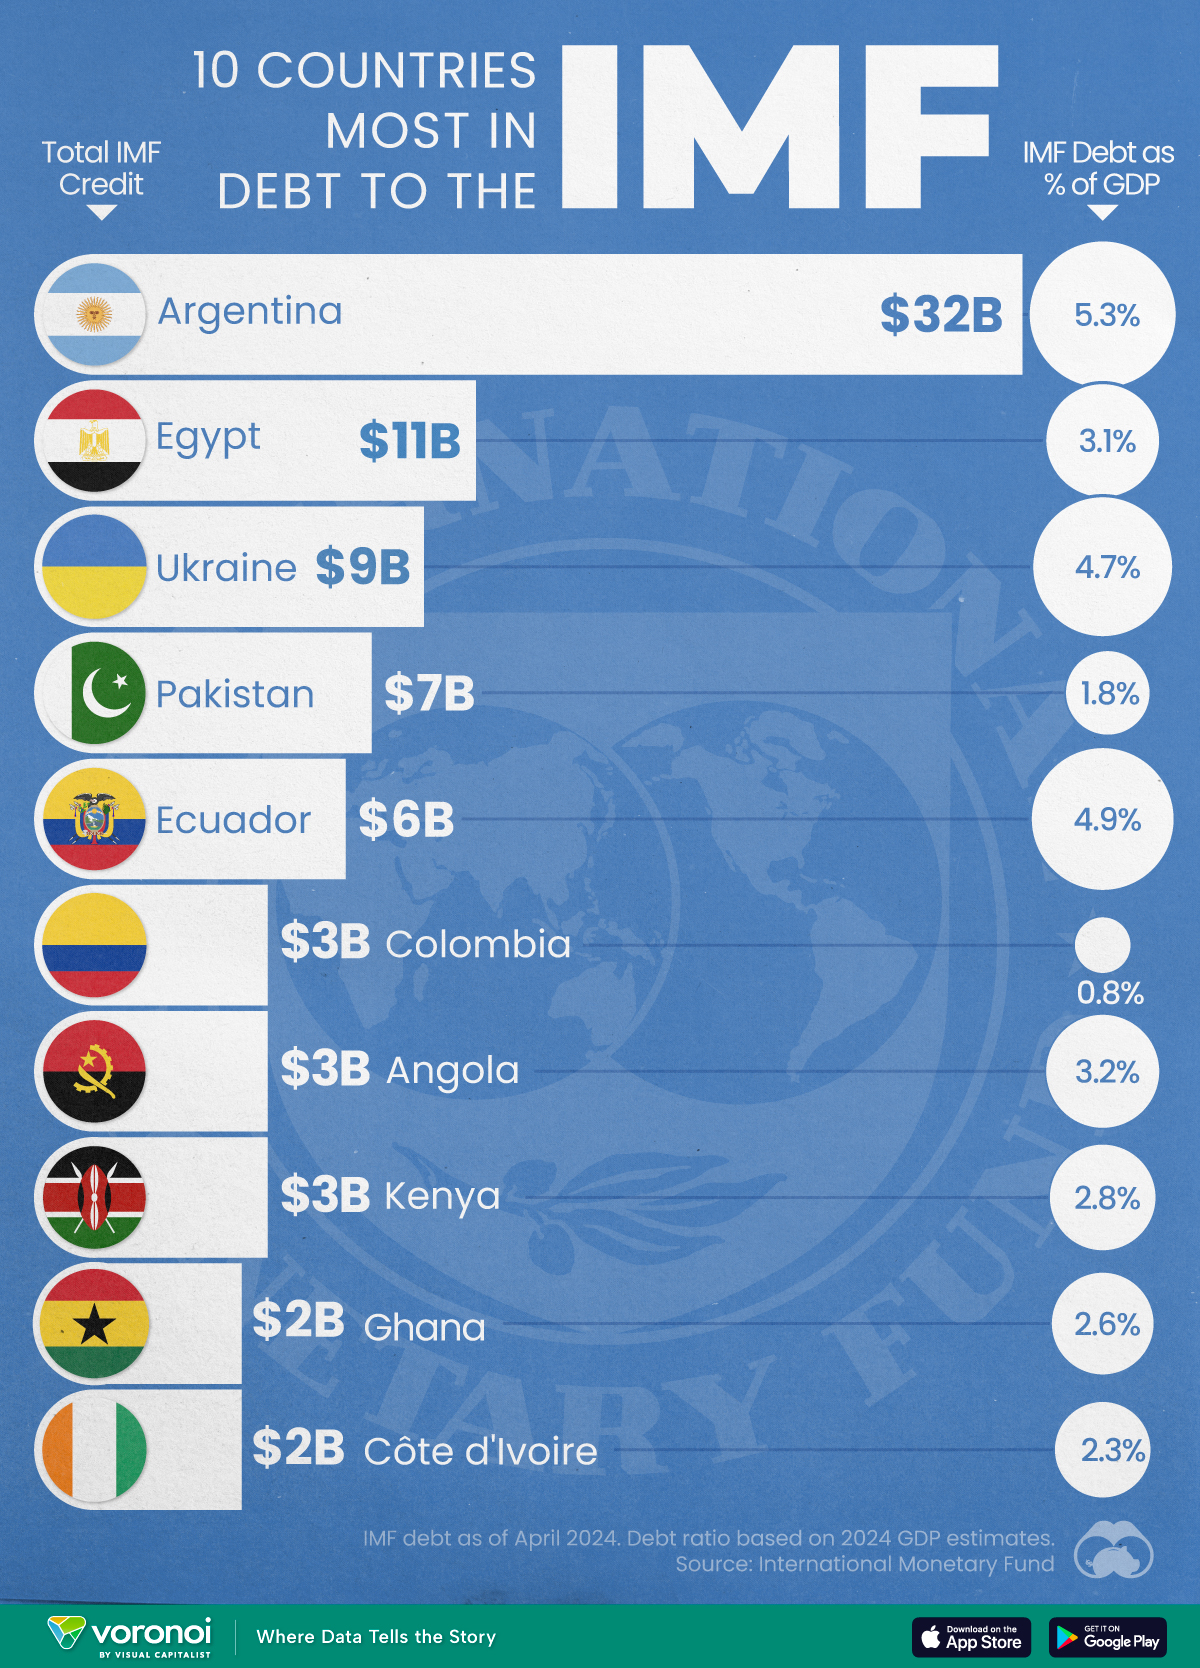
Top 10 Countries Most in Debt to the IMF
Argentina tops the ranking, with a debt equivalent to 5.3% of the country’s GDP.
Top 10 Countries Most in Debt to the IMF
This was originally posted on our Voronoi app. Download the app for free on iOS or Android and discover incredible data-driven charts from a variety of trusted sources.
Established in 1944, the International Monetary Fund (IMF) supports countries’ economic growth by providing financial aid and guidance on policies to enhance stability, productivity, and job opportunities.
Countries seek loans from the IMF to address economic crises, stabilize their currencies, implement structural reforms, and alleviate balance of payments difficulties.
In this graphic, we visualize the 10 countries most indebted to the fund.
Methodology
We compiled this ranking using the International Monetary Fund’s data on Total IMF Credit Outstanding. We selected the latest debt data for each country, accurate as of April 29, 2024.
Argentina Tops the Rank
Argentina’s debt to the IMF is equivalent to 5.3% of the country’s GDP. In total, the country owns more than $32 billion.
| Country | IMF Credit Outstanding ($B) | GDP ($B, 2024) | IMF Debt as % of GDP |
|---|---|---|---|
| 🇦🇷 Argentina | 32 | 604.3 | 5.3 |
| 🇪🇬 Egypt | 11 | 347.6 | 3.1 |
| 🇺🇦 Ukraine | 9 | 188.9 | 4.7 |
| 🇵🇰 Pakistan | 7 | 374.7 | 1.8 |
| 🇪🇨 Ecuador | 6 | 121.6 | 4.9 |
| 🇨🇴 Colombia | 3 | 386.1 | 0.8 |
| 🇦🇴 Angola | 3 | 92.1 | 3.2 |
| 🇰🇪 Kenya | 3 | 104.0 | 2.8 |
| 🇬🇭 Ghana | 2 | 75.2 | 2.6 |
| 🇨🇮 Ivory Coast | 2 | 86.9 | 2.3 |
A G20 member and major grain exporter, the country’s history of debt trouble dates back to the late 1890s when it defaulted after contracting debts to modernize the capital, Buenos Aires. It has already been bailed out over 20 times in the last six decades by the IMF.
Five of the 10 most indebted countries are in Africa, while three are in South America.
The only European country on our list, Ukraine has relied on international support amidst the conflict with Russia. It is estimated that Russia’s full-scale invasion of the country caused the loss of a third of the country’s economy. The country owes $9 billion to the IMF.
In total, almost 100 countries owe money to the IMF, and the grand total of all of these debts is $111 billion. The above countries (top 10) account for about 69% of these debts.

-

 Technology1 week ago
Countries With the Highest Rates of Crypto Ownership
-

 Mining6 days ago
Visualizing Copper Production by Country in 2023
-

 Politics7 days ago
Charted: How Americans Feel About Federal Government Agencies
-

 Healthcare1 week ago
Which Countries Have the Highest Infant Mortality Rates?
-

 Demographics1 week ago
Mapped: U.S. Immigrants by Region
-

 Economy1 week ago
Mapped: Southeast Asia’s GDP Per Capita, by Country
-

 Automotive1 week ago
How People Get Around in America, Europe, and Asia
-

 Personal Finance1 week ago
Visualizing the Tax Burden of Every U.S. State