Misc
The Most Popular Cocktail Drinks in 2024
![]() See this visualization first on the Voronoi app.
See this visualization first on the Voronoi app.
Charted: Which are the Most Popular Cocktail Drinks?
This was originally posted on our Voronoi app. Download the app for free on iOS or Android and discover incredible data-driven charts from a variety of trusted sources.
Dry January might be be required to recover from the excesses of the holidays, but a whole new year beckons with more successes, milestones, and achievements, perhaps requiring more or less libations, depending on the country one is from.
But what are people craving from their alcohol mixes?
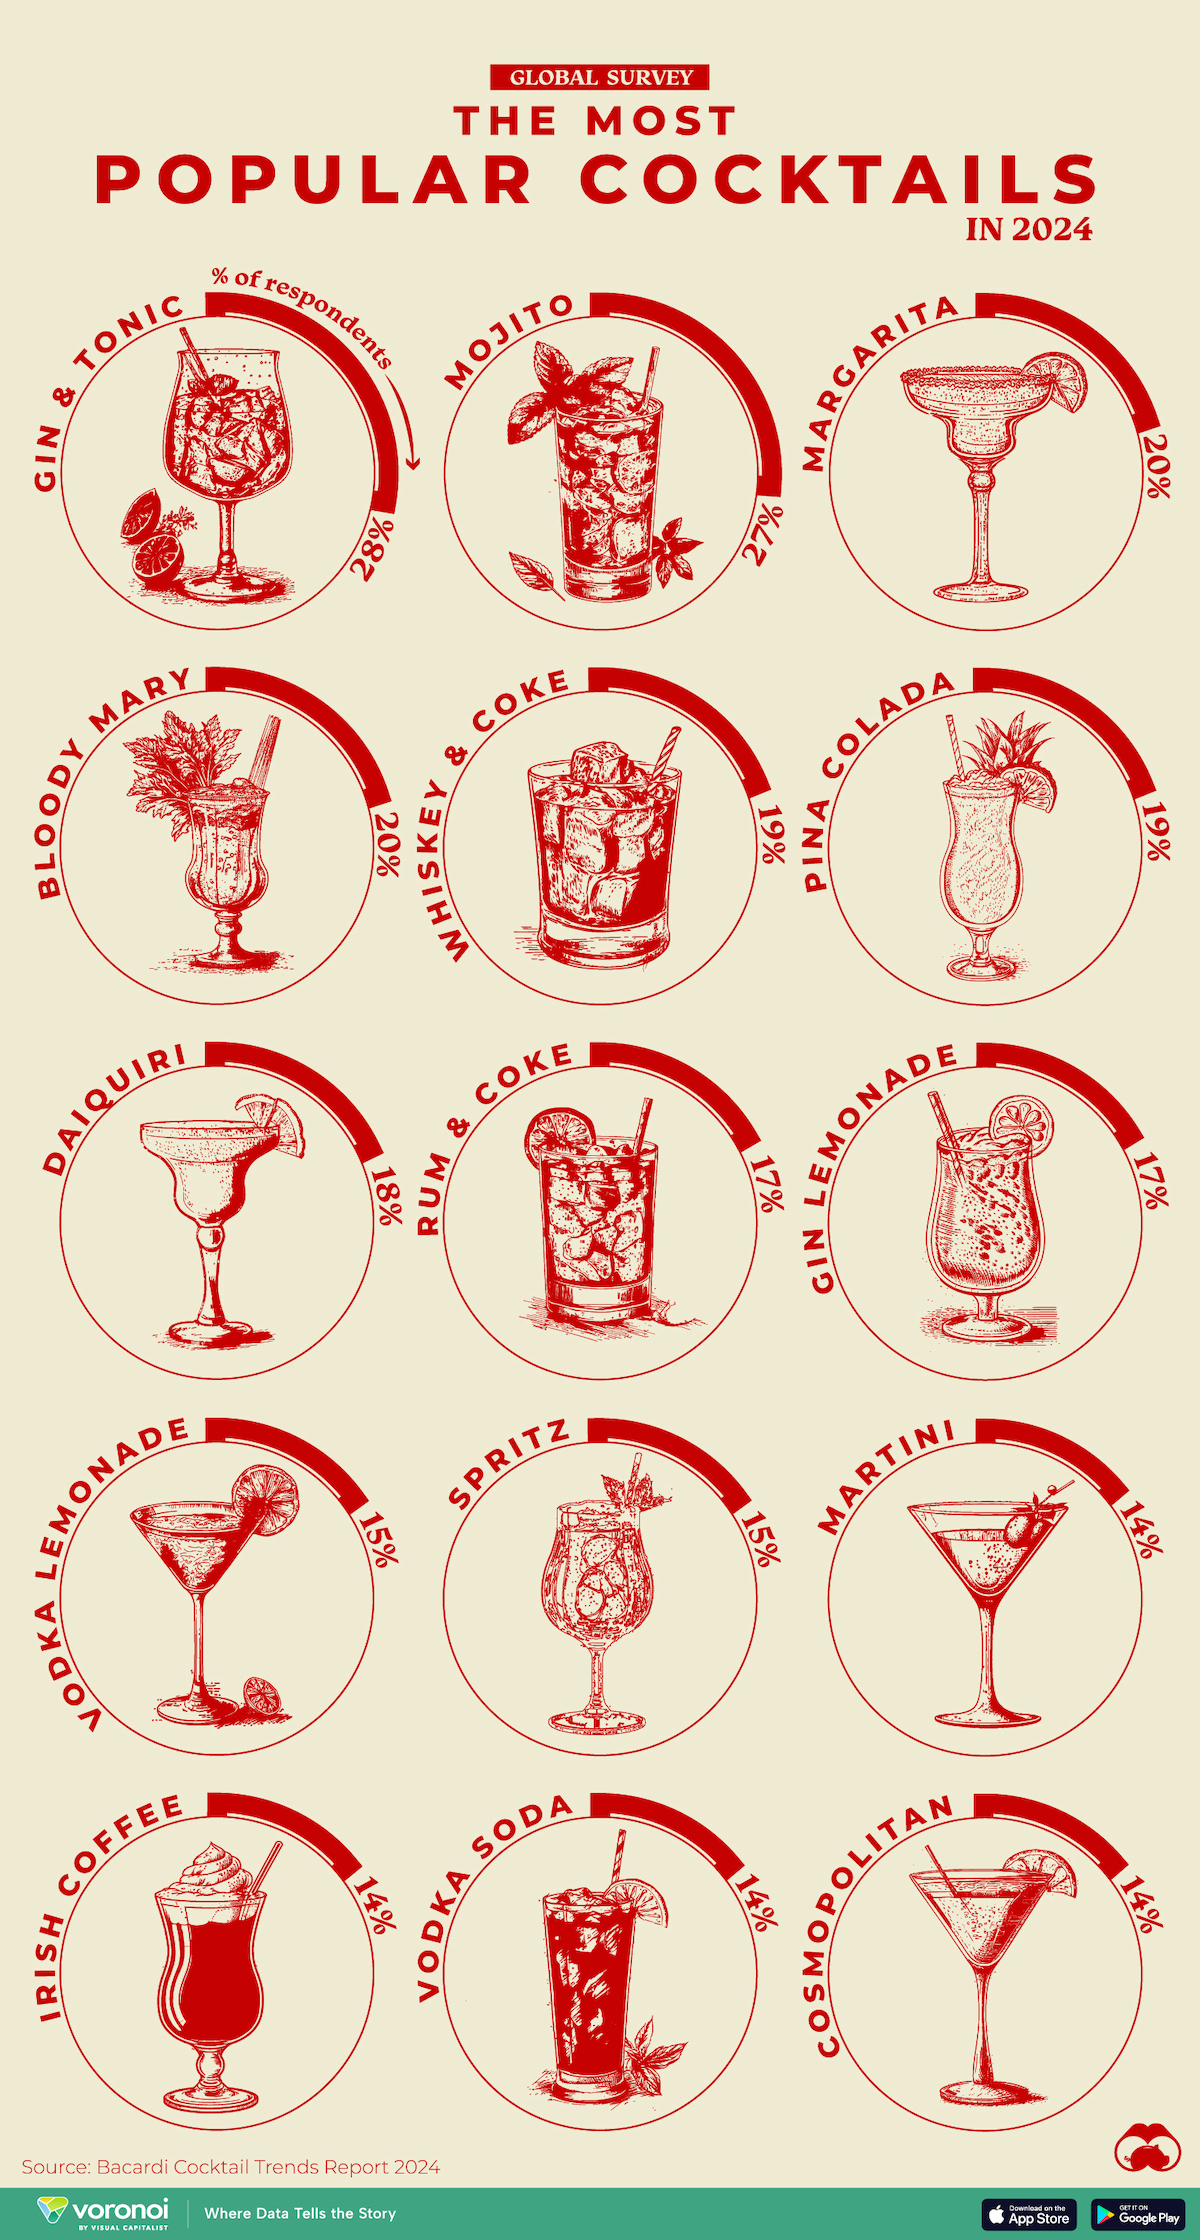
We chart out the most popular cocktail drinks in 2024, according to the annual consumer survey from the Bacardi Cocktail Trends Report.
Ranked: Most Popular Cocktails for 2024
The ever-versatile, but long-enduring Gin & Tonic comes in at first place (28%) for the most popular cocktail drink chosen by Bacardi’s survey respondents.
Allegedly, the Gin & Tonic traces back to 19th century India, when English soldiers began mixing their daily rations of quinine tonic with gin. Quinine was a common malaria drug up until the early 1900s.
The modern G&T is coupled with a fistful of ice and makes for a refreshing summer beverage. Its popularity is unparalleled across the Commonwealth, but also finds patrons in Europe, the U.S., Japan, and the Netherlands.
| Rank | Cocktail | % of Respondents |
|---|---|---|
| 1 | Gin & Tonic | 28% |
| 2 | Mojito | 27% |
| 3 | Margarita | 20% |
| 4 | Bloody Mary | 20% |
| 5 | Whisky and Coke | 19% |
| 6 | Pina Colada | 19% |
| 7 | Daiquiri | 18% |
| 8 | Rum and Coke | 17% |
| 9 | Gin Lemonade | 17% |
| 10 | Vodka Lemonade | 15% |
| 11 | Spritz | 15% |
| 12 | Martini | 14% |
| 13 | Irish Coffee | 14% |
| 14 | Vodka Soda | 14% |
| 15 | Cosmopolitan | 14% |
| 16 | Espresso Martini | 13% |
| 17 | Caipirinha | 12% |
| 18 | Tequila Sunrise | 11% |
| 19 | Whiskey Highball | 10% |
| 20 | Tequila Soda | 10% |
Note: The survey was designed as multiple choice, thus percentages do not sum to 100.
Another classic summer favorite, the Mojito comes in a close second (27%) by those surveyed. The white rum based cocktail originated in Cuba, though there is much debate on who (or which group) invented it first. Variations include using tequila instead of rum, adding muddled fruit, and switching out lime for lemon juice.
The Margarita and Bloody Mary tie for fourth place and the unpretentious but clearly popular Whiskey and Coke rounds out the top five.
Another 19% also love Piña Coladas (and possibly also dancing in the rain), a delicious blended mix of white-rum, cream of coconut, and pineapple juice. This island favorite is the official drink of Puerto Rico, from where it originates.
Ranked seven to 10, are two more rum-based drinks (the Daiquiri, and the Rum and Coke) and two lemonade mixes with gin and vodka respectively.


Maps
Mapped: The Top Export in Each EU Country
Cars and petroleum dominate the European Union exports.
The Top European Union Exports by Country
This was originally posted on our Voronoi app. Download the app for free on iOS or Android and discover incredible data-driven charts from a variety of trusted sources.
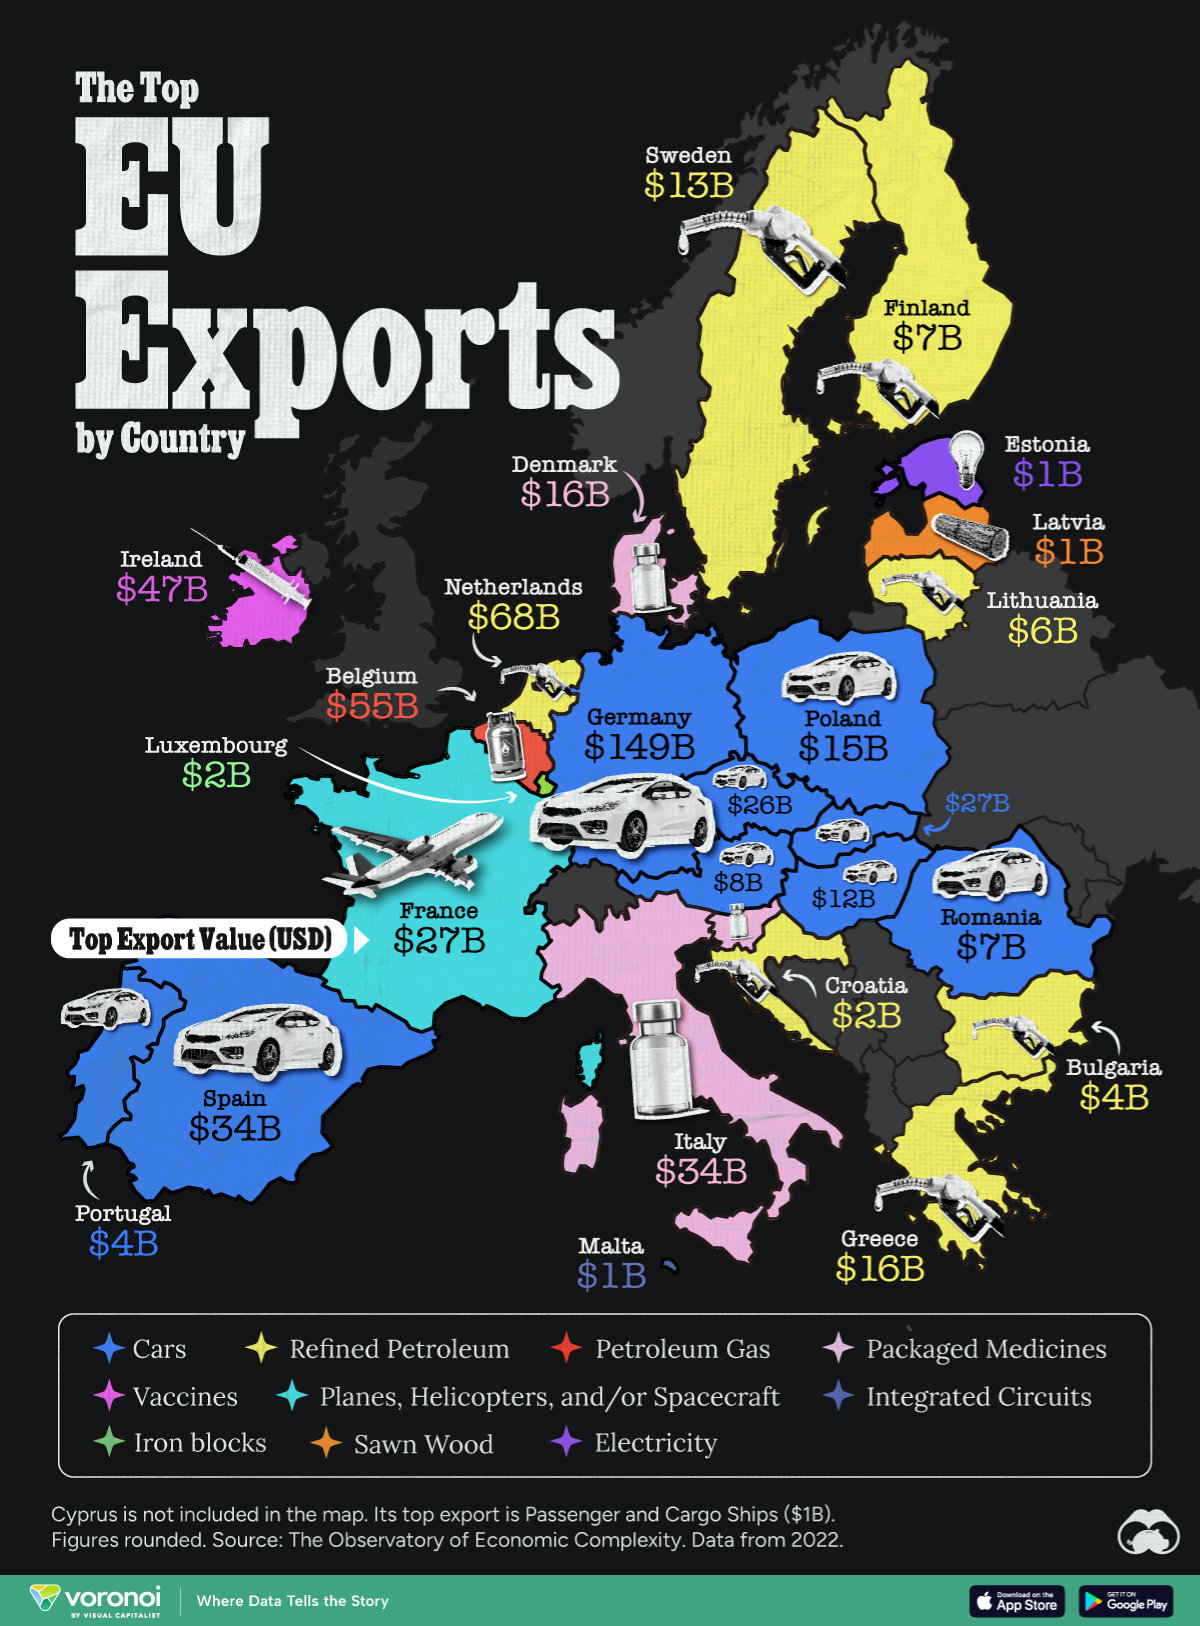
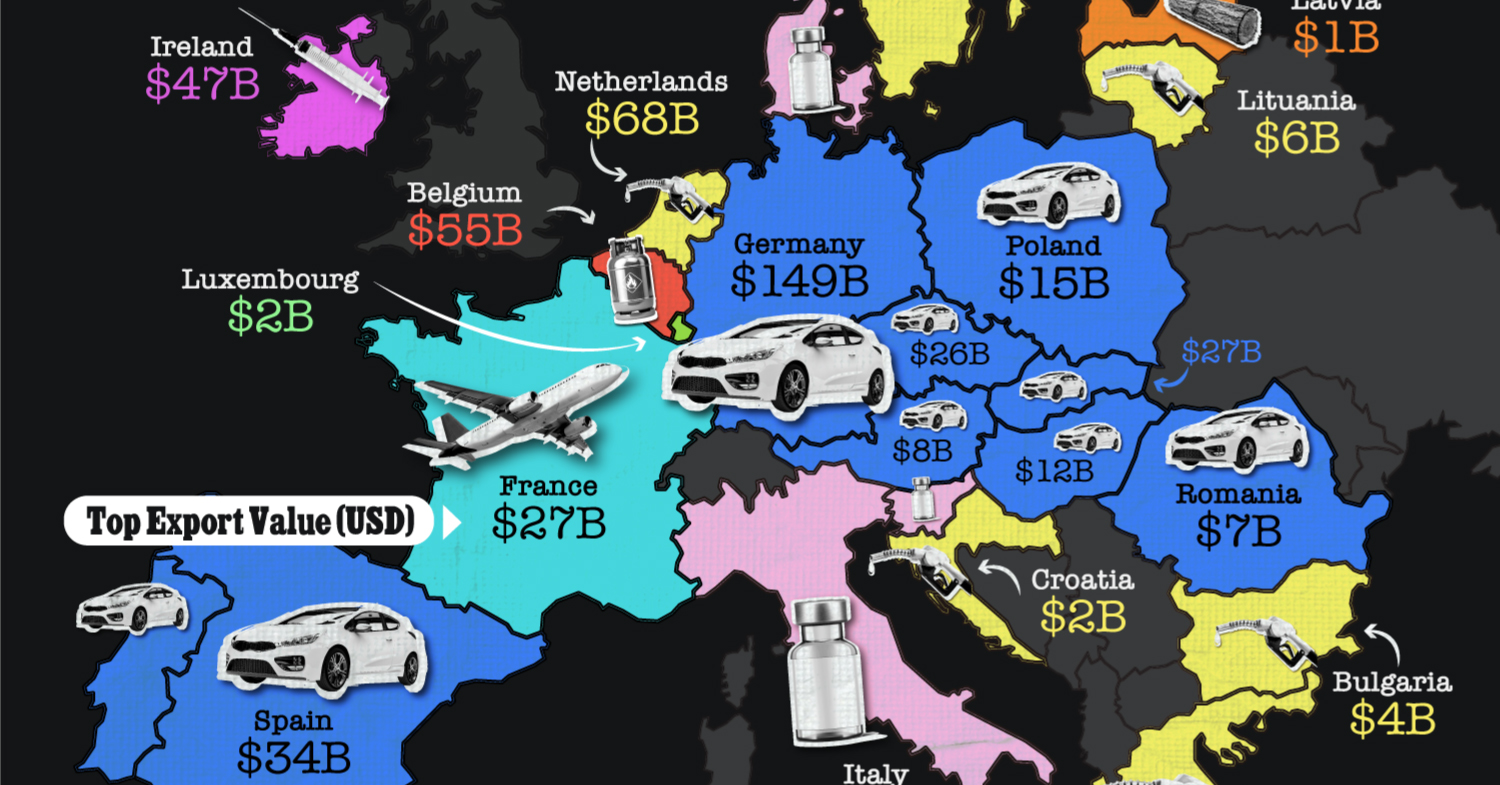
The European Union (EU) exports over $6 trillion in products annually. The bloc boasts a diversified economy that encompasses fuel and mineral industries, cars, vaccines, and technology.
In this map, we display European Union countries’ top exports as of 2022. Data for the map was sourced from The Observatory of Economic Complexity.
Cars and Petroleum Dominate EU Exports
Belgium, Bulgaria, Croatia, Finland, Greece, Lithuania, Sweden, and the Netherlands have petroleum gas or refined petroleum as their top export product.
The Netherlands exported $68.1 billion worth of refined petroleum in 2022, ranking third among the largest exporters globally. The country is home to BP Rotterdam Refinery, the biggest oil refinery in Europe.
| Country | Top Export (2022) | Value (USD Billions) |
|---|---|---|
| 🇦🇹 Austria | Cars | $7.7B |
| 🇧🇪 Belgium | Petroleum Gas | $54.7B |
| 🇧🇬 Bulgaria | Refined Petroleum | $3.5B |
| 🇭🇷 Croatia | Refined Petroleum | $1.5B |
| 🇨🇾 Cyprus | Passenger and Cargo Ships | $1.3B |
| 🇨🇿 Czech Republic | Cars | $25.5B |
| 🇩🇰 Denmark | Packaged Medicines | $15.9B |
| 🇪🇪 Estonia | Electricity | $1.1B |
| 🇫🇮 Finland | Refined Petroleum | $6.9B |
| 🇫🇷 France | Planes, Helicopters, and/or Spacecraft | $26.6B |
| 🇩🇪 Germany | Cars | $149.0B |
| 🇬🇷 Greece | Refined Petroleum | $16.4B |
| 🇭🇺 Hungary | Cars | $12.3B |
| 🇮🇪 Ireland | Vaccines | $47.3B |
| 🇮🇹 Italy | Packaged Medicines | $34.4B |
| 🇱🇻 Latvia | Sawn Wood | $1.2B |
| 🇱🇹 Lithuania | Refined Petroleum | $5.5B |
| 🇱🇺 Luxembourg | Iron blocks | $1.6B |
| 🇲🇹 Malta | Integrated Circuits | $1.1B |
| 🇳🇱 Netherlands | Refined Petroleum | $68.1B |
| 🇵🇱 Poland | Cars (parts & accessories) | $15.3B |
| 🇵🇹 Portugal | Cars | $4.4B |
| 🇷🇴 Romania | Cars | $6.7B |
| 🇸🇰 Slovakia | Cars | $26.9B |
| 🇸🇮 Slovenia | Packaged Medicines | $12.5B |
| 🇪🇸 Spain | Cars | $33.6B |
| 🇸🇪 Sweden | Refined Petroleum | $12.9B |
Besides petroleum, automobiles (and automobile parts) significantly contribute to the EU economy. Austria, Czech Republic, Germany, Hungary, Portugal, Poland, Romania, Slovakia, and Spain have automotive products as their top exports.
With well-known car brands such as Volkswagen, BMW, Mercedes-Benz, Audi, and Porsche, Germany alone generates around $150 billion per year from car exports.
Other products help diversify the EU economy. France’s top export is planes, helicopters, and/or spacecraft, while Italy and Denmark excel in the packaged medicines industry. Ireland has a significant pharmaceutical industry, hosting major companies such as Pfizer, Johnson & Johnson, Merck, and Novartis.

-

 Maps1 week ago
Mapped: U.S. States By Number of Cities Over 250,000 Residents
-

 Markets2 weeks ago
Mapped: Europe’s GDP Per Capita, by Country
-

 Money2 weeks ago
Charted: What Frustrates Americans About the Tax System
-

 Technology2 weeks ago
Countries With the Highest Rates of Crypto Ownership
-

 Mining2 weeks ago
Where the World’s Aluminum is Smelted, by Country
-

 Personal Finance2 weeks ago
Visualizing the Tax Burden of Every U.S. State
-

 Automotive2 weeks ago
How People Get Around in America, Europe, and Asia
-

 Maps2 weeks ago
Mapped: Southeast Asia’s GDP Per Capita, by Country