Misc
Ranked: The World’s Top 10 Automotive Exporters (2000-2022)
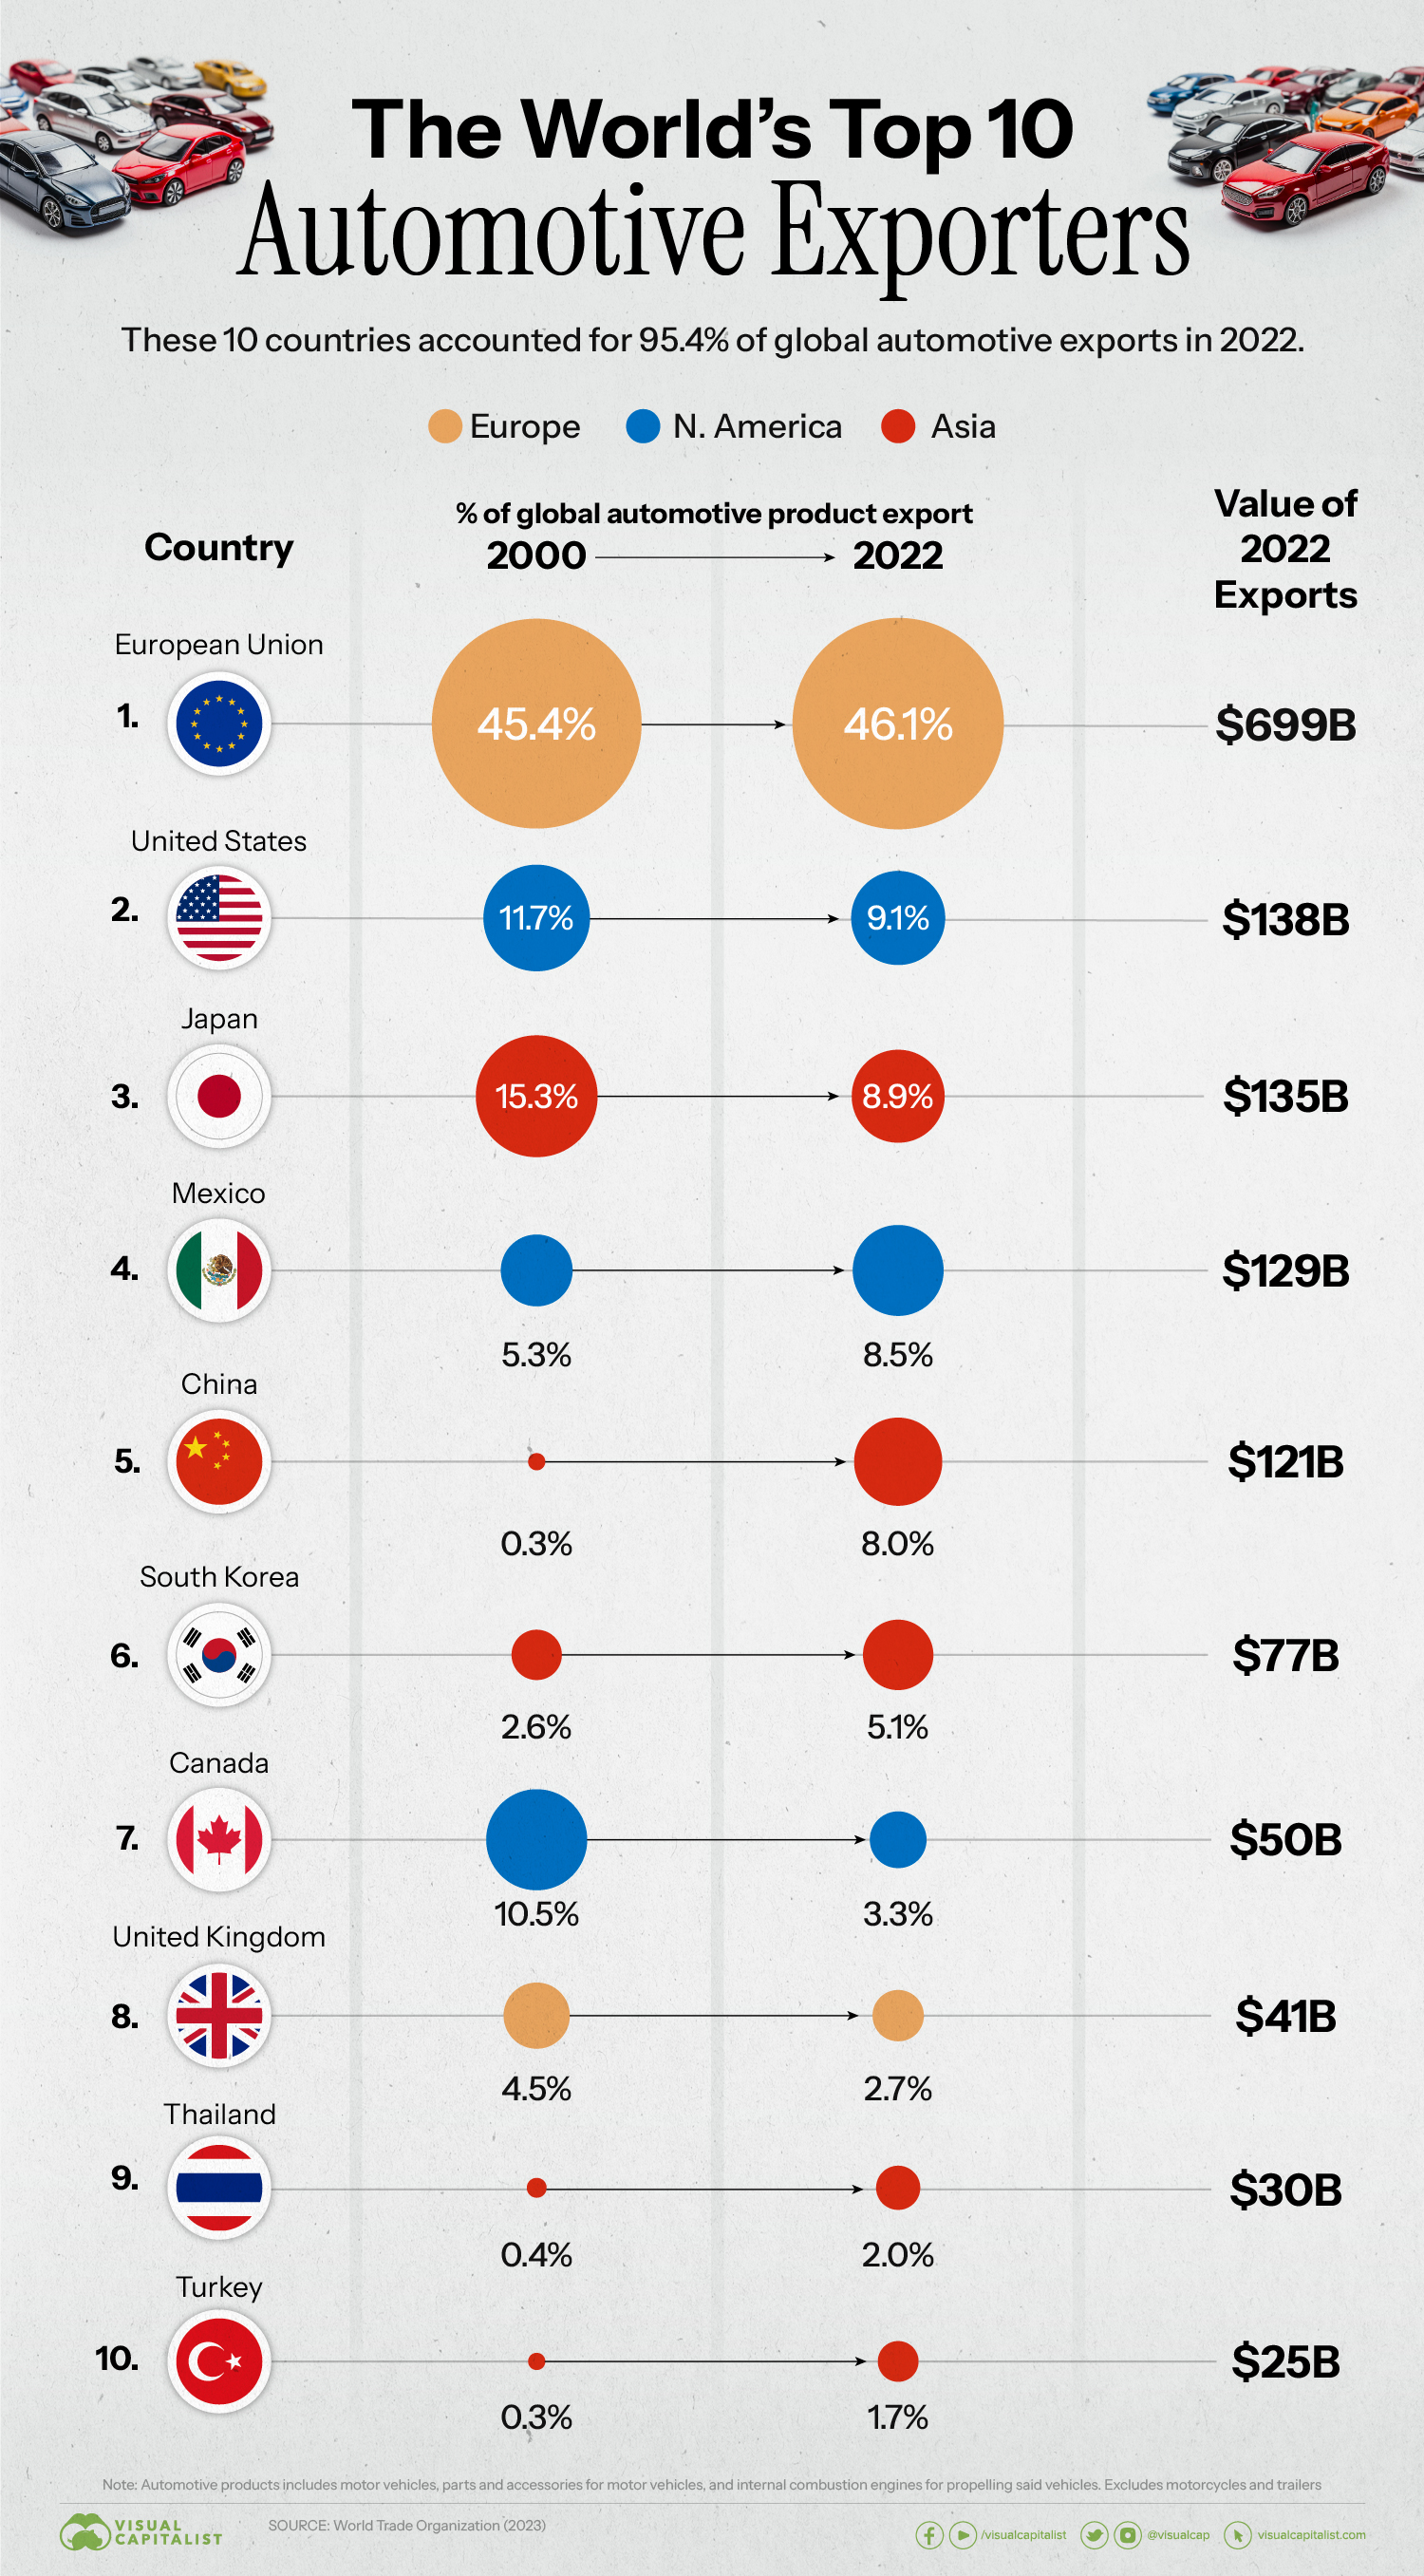
Ranked: The World’s Top 10 Automotive Exporters
According to the European Automobile Manufacturers’ Association, over 85 million motor vehicles were built around the world in 2022.
In this graphic, we add context to this massive figure by ranking the world’s 10 largest automotive exporters. The list is based on data from the World Trade Organization (WTO) and includes countries from nearly every corner of the world, highlighting the global nature of the industry.
Top 10 Exporting Countries
The data we used to create this graphic is included in the table below. It represents each country’s share of the total export value of global automotive products in both 2000 and 2022.
“Automotive products” are defined by the WTO as motor vehicles, parts and accessories for motor vehicles, and internal combustion engines for propelling said vehicles. This grouping excludes motorcycles and trailers.
| Exporter | 2000 (% of world exports) | 2022 (% of world exports) | Change (pp) |
|---|---|---|---|
| 🇪🇺 EU | 45.4% | 46.1% | +0.7 |
| 🇺🇸 U.S. | 11.7% | 9.1% | -2.6 |
| 🇯🇵 Japan | 15.3% | 8.9% | -6.4 |
| 🇲🇽 Mexico | 5.3% | 8.5% | +3.2 |
| 🇨🇳 China | 0.3% | 8.0% | +7.7 |
| 🇰🇷 South Korea | 2.6% | 5.1% | +2.5 |
| 🇨🇦 Canada | 10.5% | 3.3% | -7.2 |
| 🇬🇧 UK | 4.5% | 2.7% | -1.8 |
| 🇹🇭 Thailand | 0.4% | 2.0% | +1.6 |
| 🇹🇷 Türkiye | 0.3% | 1.7% | +1.4 |
| Total | 96.3% | 95.4% | -- |
From this list we can identify which countries have experienced the most growth or decline over the past 22 years.
Countries With the Most Growth Since 2000
The automotive exporters that grew their share of global value the most since 2000 are China (+7.7 pp), Mexico (+3.2 pp), and South Korea (+2.5 pp).
There are clear drivers behind each of these growth stories.
For example, China became the world’s largest car market back in 2009, which accelerated the growth of its domestic automakers. China is also home to some of the world’s biggest automotive suppliers, including Weichai (diesel engines), Hasco Automotive (drivetrain and air conditioning systems), and CATL (EV batteries).
Mexico, on the other hand, has grown its auto industry by enticing global brands to construct their factories there. The country’s competitive edge includes cheaper labor and a land border to the United States.
Finally there’s South Korea, whose growth is largely attributed to Hyundai Motor Company. The Seoul-based automaker recently became the third largest on a global basis, trailing only Toyota and Volkswagen.
Countries With the Biggest Decline Since 2000
The automotive exporters that declined the most since 2000 are Canada (-7.2 pp), Japan (-6.4 pp), and the U.S. (-2.6 pp).
Canada’s auto industry has experienced a steady decline in recent years, though new EV-related investments could turn things around. In March 2022, Stellantis and LG Energy Solutions announced the construction of a $3.5 billion EV battery plant in Windsor, Ontario.
Canada’s automotive industry is largely concentrated in the province of Ontario, which neighbors Michigan, the top state for U.S. car production.


Misc
The Top 25 Nationalities of U.S. Immigrants
Mexico is the largest source of immigrants to the U.S., with almost 11 million immigrants.


The Top 25 Nationalities of U.S. Immigrants
This was originally posted on our Voronoi app. Download the app for free on iOS or Android and discover incredible data-driven charts from a variety of trusted sources.
The United States is home to more than 46 million immigrants, constituting approximately 14% of its total population.
This graphic displays the top 25 countries of origin for U.S. immigrants, based on 2022 estimates. The data is sourced from the Migration Policy Institute (MPI), which analyzed information from the U.S. Census Bureau’s 2022 American Community Survey.
In this context, “immigrants” refer to individuals residing in the United States who were not U.S. citizens at birth.
Mexico Emerges as a Leading Source of Immigration
Mexico stands out as the largest contributor to U.S. immigration due to its geographical proximity and historical ties.
Various economic factors, including wage disparities and employment opportunities, motivate many Mexicans to seek better prospects north of the border.
| Country | Region | # of Immigrants |
|---|---|---|
| 🇲🇽 Mexico | Latin America & Caribbean | 10,678,502 |
| 🇮🇳 India | Asia | 2,839,618 |
| 🇨🇳 China | Asia | 2,217,894 |
| 🇵🇭 Philippines | Asia | 1,982,333 |
| 🇸🇻 El Salvador | Latin America & Caribbean | 1,407,622 |
| 🇻🇳 Vietnam | Asia | 1,331,192 |
| 🇨🇺 Cuba | Latin America & Caribbean | 1,312,510 |
| 🇩🇴 Dominican Republic | Latin America & Caribbean | 1,279,900 |
| 🇬🇹 Guatemala | Latin America & Caribbean | 1,148,543 |
| 🇰🇷 Korea | Asia | 1,045,100 |
| 🇨🇴 Colombia | Latin America & Caribbean | 928,053 |
| 🇭🇳 Honduras | Latin America & Caribbean | 843,774 |
| 🇨🇦 Canada | Northern America | 821,322 |
| 🇯🇲 Jamaica | Latin America & Caribbean | 804,775 |
| 🇭🇹 Haiti | Latin America & Caribbean | 730,780 |
| 🇬🇧 United Kingdom | Europe | 676,652 |
| 🇻🇪 Venezuela | Latin America & Caribbean | 667,664 |
| 🇧🇷 Brazil | Latin America & Caribbean | 618,525 |
| 🇩🇪 Germany | Europe | 537,484 |
| 🇪🇨 Ecuador | Latin America & Caribbean | 518,287 |
| 🇵🇪 Peru | Latin America & Caribbean | 471,988 |
| 🇳🇬 Nigeria | Africa | 448,405 |
| 🇺🇦 Ukraine | Europe | 427,163 |
| 🇮🇷 Iran | Middle East | 407,283 |
| 🇵🇰 Pakistan | Asia | 399,086 |
| Rest of World | 11,637,634 | |
| Total | 46,182,089 |
Mexicans are followed in this ranking by Indians, Chinese, and Filipinos, though most immigrants on this list come from countries in the Latin American and Caribbean region.
On the other hand, only three European countries are among the top sources of U.S. immigrants: the UK, Germany, and Ukraine.
Immigration continues to be a significant factor contributing to the overall growth of the U.S. population. Overall population growth has decelerated over the past decade primarily due to declining birth rates.
Between 2021 and 2022, the increase in the immigrant population accounted for 65% of the total population growth in the U.S., representing 912,000 individuals out of nearly 1.4 million.
If you enjoyed this post, be sure to check out Visualized: Why Do People Immigrate to the U.S.? This visualization shows the different reasons cited by new arrivals to America in 2021.

-

 United States7 days ago
Mapped: Countries Where Recreational Cannabis is Legal
-

 Healthcare2 weeks ago
Life Expectancy by Region (1950-2050F)
-

 Markets2 weeks ago
The Growth of a $1,000 Equity Investment, by Stock Market
-

 Markets2 weeks ago
Mapped: Europe’s GDP Per Capita, by Country
-

 Money2 weeks ago
Charted: What Frustrates Americans About the Tax System
-

 Technology2 weeks ago
Countries With the Highest Rates of Crypto Ownership
-

 Mining2 weeks ago
Where the World’s Aluminum is Smelted, by Country
-

 Personal Finance2 weeks ago
Visualizing the Tax Burden of Every U.S. State