Mapped: The 10 U.S. States With the Lowest Real GDP Growth
Ranked: The World’s 50 Largest Private Equity Firms
Top 10 Countries Most in Debt to the IMF
Ranked: The Top 6 Economies by Share of Global GDP (1980-2024)
Mapped: Europe’s GDP Per Capita, by Country
Countries With the Highest Rates of Crypto Ownership
Mapped: The Number of AI Startups By Country
All of the Grants Given by the U.S. CHIPS Act
Visualizing AI Patents by Country
How Tech Logos Have Evolved Over Time
Visualizing America’s Average Retirement Savings, by Age
Visualizing the Tax Burden of Every U.S. State
Charted: What Frustrates Americans About the Tax System
Ranked: The Top 20 Countries in Debt to China
Mapped: Countries Where Recreational Cannabis is Legal
Which Countries Have the Highest Infant Mortality Rates?
Life Expectancy by Region (1950-2050F)
What Causes Preventable Child Deaths?
The Cost of an EpiPen in Major Markets
Who’s Building the Most Solar Energy?
Mapped: The Age of Energy Projects in Interconnection Queues, by State
Ranked: The Top 10 EV Battery Manufacturers in 2023
The World’s Biggest Nuclear Energy Producers
The World’s Biggest Oil Producers in 2023
Mapped: The Top Exports in Asian Countries
Mapped: U.S. States By Number of Cities Over 250,000 Residents
Mapped: U.S. Immigrants by Region
The Biggest Salt Producing Countries in 2023
Visualizing Copper Production by Country in 2023
Where the World’s Aluminum is Smelted, by Country
Visualizing Global Gold Production in 2023
How People Get Around in America, Europe, and Asia
The Carbon Footprint of Major Travel Methods
Ranking the Top 15 Countries by Carbon Tax Revenue
Ranked: The Countries With the Most Air Pollution in 2023
Top Countries By Forest Growth Since 2001
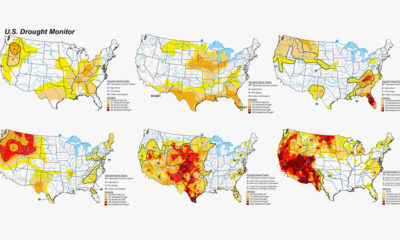
The Western U.S. is no stranger to droughts. But this year's is one of the worst yet. Here's a historical look at U.S. droughts since 1999.
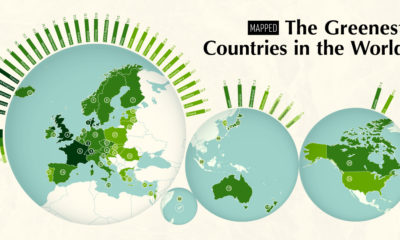
The world's growing focus on sustainability is a clear sign of the times. This map ranks the 40 greenest countries in the world.
In a complex world, the combined forces of data and visual communication take on new importance. See our top 20 visualizations for 2020.
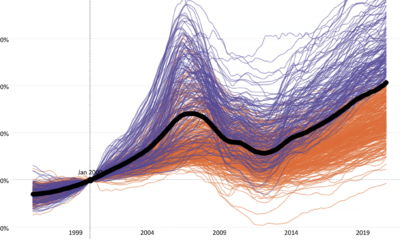
This interactive visualization tracks two decades of home price changes in hundreds of cities in the United States.
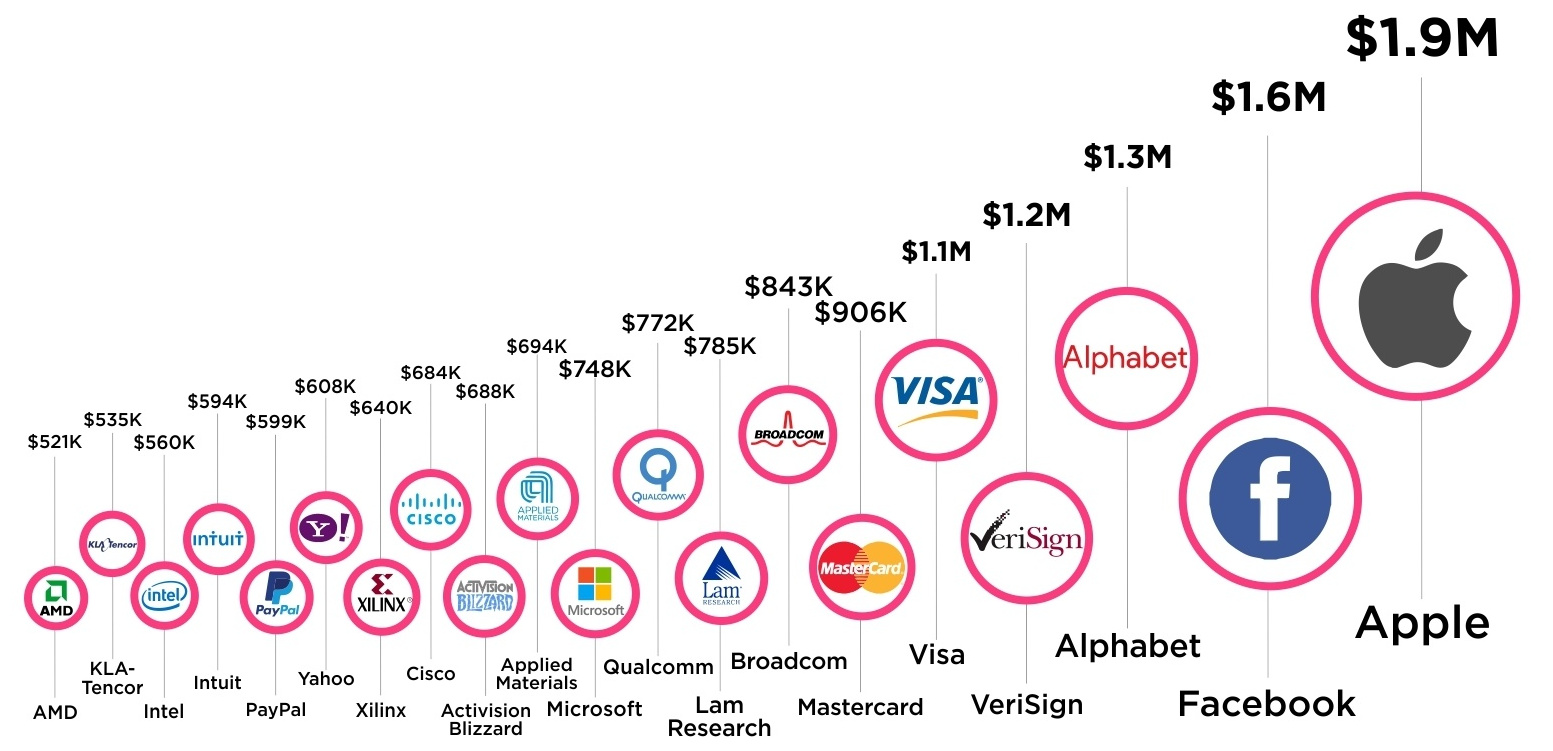
Here's how much tech companies make per person on staff - Apple, Facebook, and Alphabet all make well over $1 million in revenue per employee.
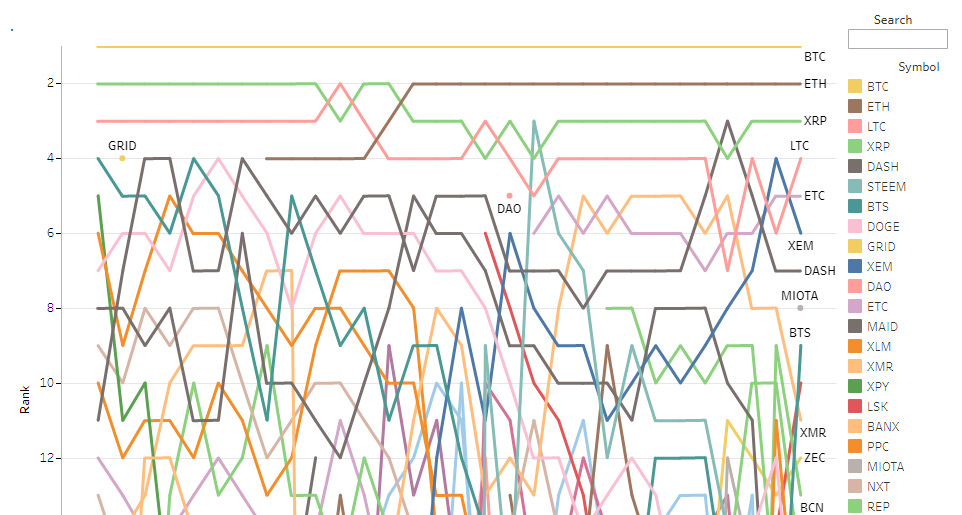
The coin universe is fast-moving and sometimes chaotic. See how the list of the top 20 cryptocurrencies has changed over the last 2.5 years.
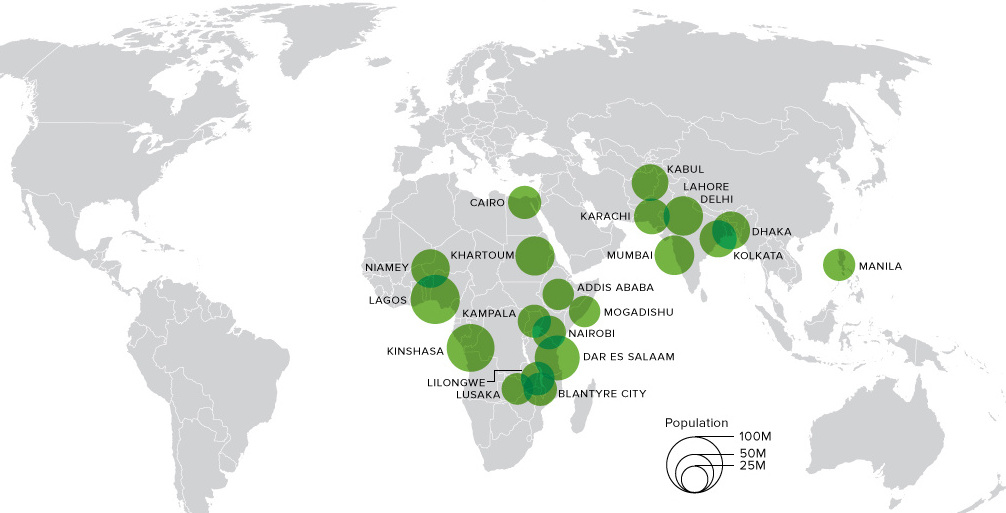
This animation shows big changes in the world's most populous cities over the next 80+ years. Africa alone will hold 13 cities bigger than NYC by...
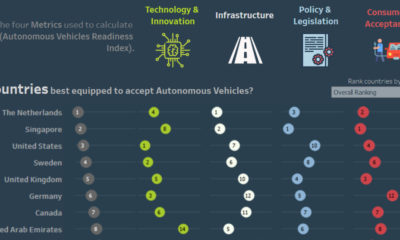
This interactive visual shows the countries best prepared for the shift to autonomous vehicles, as well as the associated societal and economic impacts.
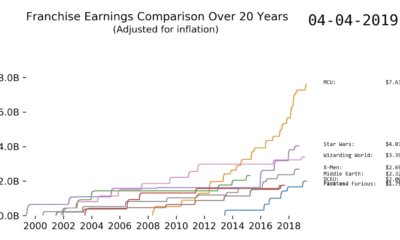
This fascinating animation charts the revenue of some big movie franchises. Watch blockbusters like Marvel shoot up the rankings over time.
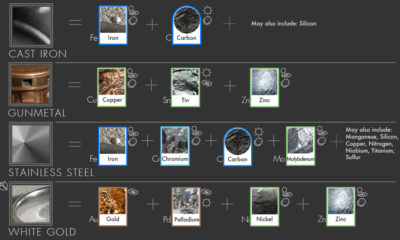
You can't find stainless steel, brass, sterling silver, or white gold on the periodic table. Learn about 20 common metal alloys, and what they are made...