Mapped: The 10 U.S. States With the Lowest Real GDP Growth
Ranked: The World’s 50 Largest Private Equity Firms
Top 10 Countries Most in Debt to the IMF
Ranked: The Top 6 Economies by Share of Global GDP (1980-2024)
Mapped: Europe’s GDP Per Capita, by Country
Countries With the Highest Rates of Crypto Ownership
Mapped: The Number of AI Startups By Country
All of the Grants Given by the U.S. CHIPS Act
Visualizing AI Patents by Country
How Tech Logos Have Evolved Over Time
Visualizing America’s Average Retirement Savings, by Age
Visualizing the Tax Burden of Every U.S. State
Charted: What Frustrates Americans About the Tax System
Ranked: The Top 20 Countries in Debt to China
Mapped: Countries Where Recreational Cannabis is Legal
Which Countries Have the Highest Infant Mortality Rates?
Life Expectancy by Region (1950-2050F)
What Causes Preventable Child Deaths?
The Cost of an EpiPen in Major Markets
Who’s Building the Most Solar Energy?
Mapped: The Age of Energy Projects in Interconnection Queues, by State
Ranked: The Top 10 EV Battery Manufacturers in 2023
The World’s Biggest Nuclear Energy Producers
The World’s Biggest Oil Producers in 2023
Mapped: The Top Exports in Asian Countries
Mapped: U.S. States By Number of Cities Over 250,000 Residents
Mapped: U.S. Immigrants by Region
The Biggest Salt Producing Countries in 2023
Visualizing Copper Production by Country in 2023
Where the World’s Aluminum is Smelted, by Country
Visualizing Global Gold Production in 2023
How People Get Around in America, Europe, and Asia
The Carbon Footprint of Major Travel Methods
Ranking the Top 15 Countries by Carbon Tax Revenue
Ranked: The Countries With the Most Air Pollution in 2023
Top Countries By Forest Growth Since 2001
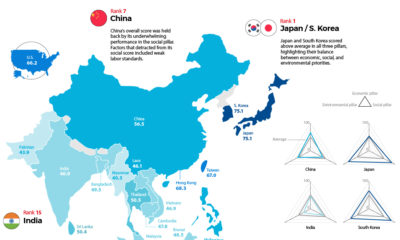
The Sustainable Trade Index ranks 19 Asian economies and the U.S. across three categories of trade sustainability.
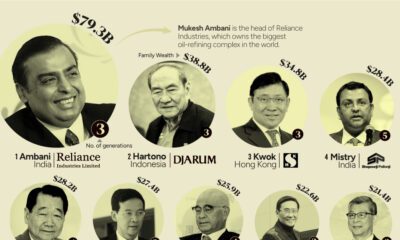
This graphic shows the 15 richest families in Asia. From energy to banking, these dynasties have built fortunes across many sectors.
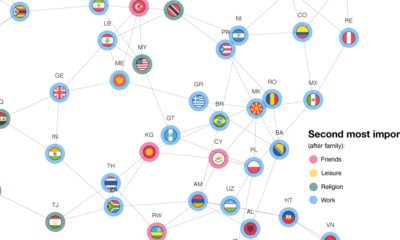
Where you're from greatly influencers how you view the world. Here's a look at the core values in 94 different countries.
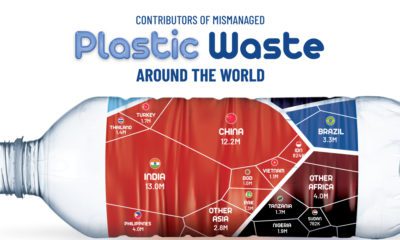
About 22% of the world's annual plastic waste generation is mismanaged. Here's a break down of mismanaged plastic waste by country.
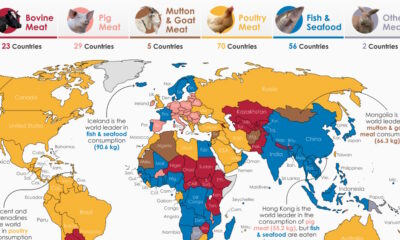
By examining meat consumption by country, we uncover regional differences in how much, and what type of meat people around the world prefer.
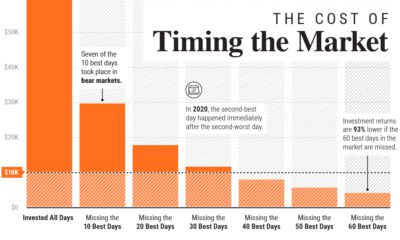
In this graphic, we show why timing the market is extremely difficult, and how it can meaningfully dent portfolio returns.
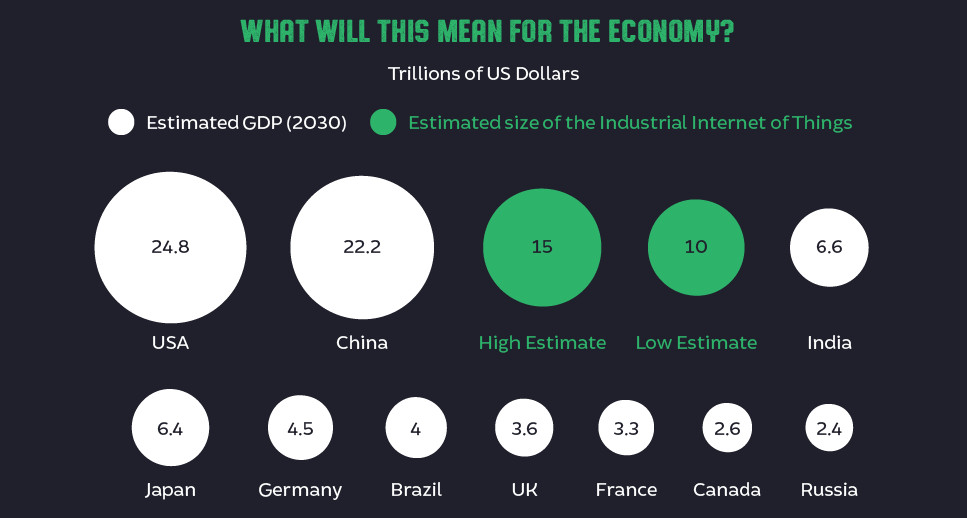
The Industrial Internet of Things may be less sexy than its consumer-facing IoT counterpart, but here's how it could be a game-changer for the economy.
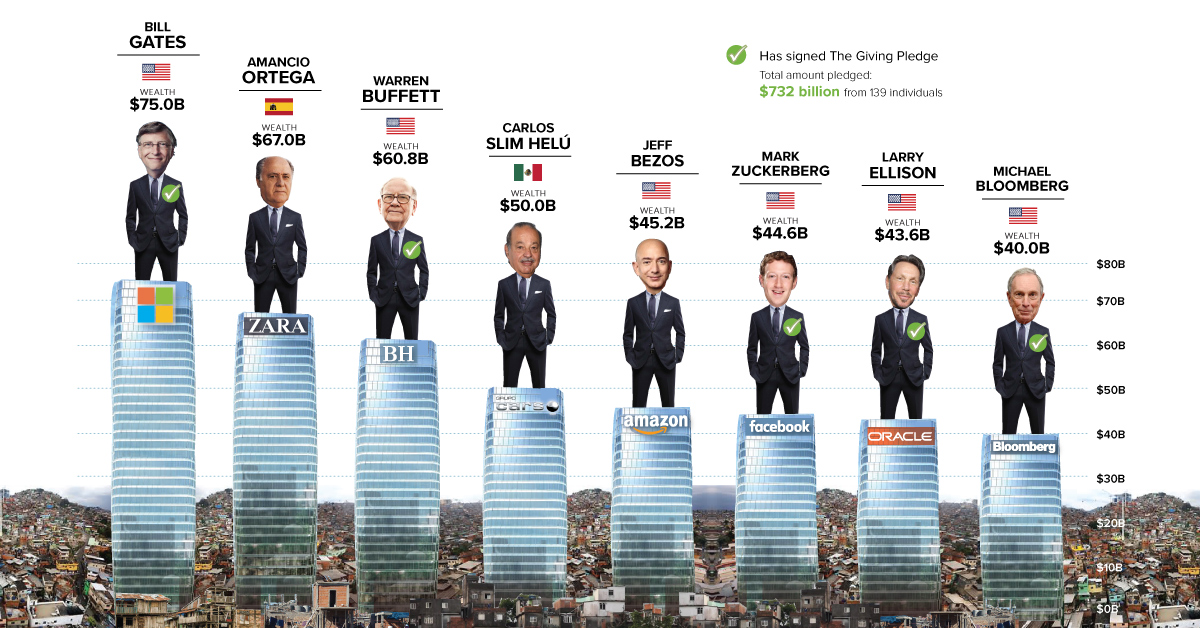
Eight men have the same wealth as the poorest 50% - we use the Oxfam report as a springboard to dive into a discussion on inequality,...
A significant share of respondents from an ASEAN-focused survey are not happy about rising American and Chinese influence in the region.
We visualize Asia’s population patterns to see where 4.6 billion people, or two-thirds of the world’s population, actually live.


 Creator Program