Money
The Oxfam Report is Important, But There’s More to the Story
The Oxfam Report is Important, But There’s More to the Story
The Chart of the Week is a weekly Visual Capitalist feature on Fridays.
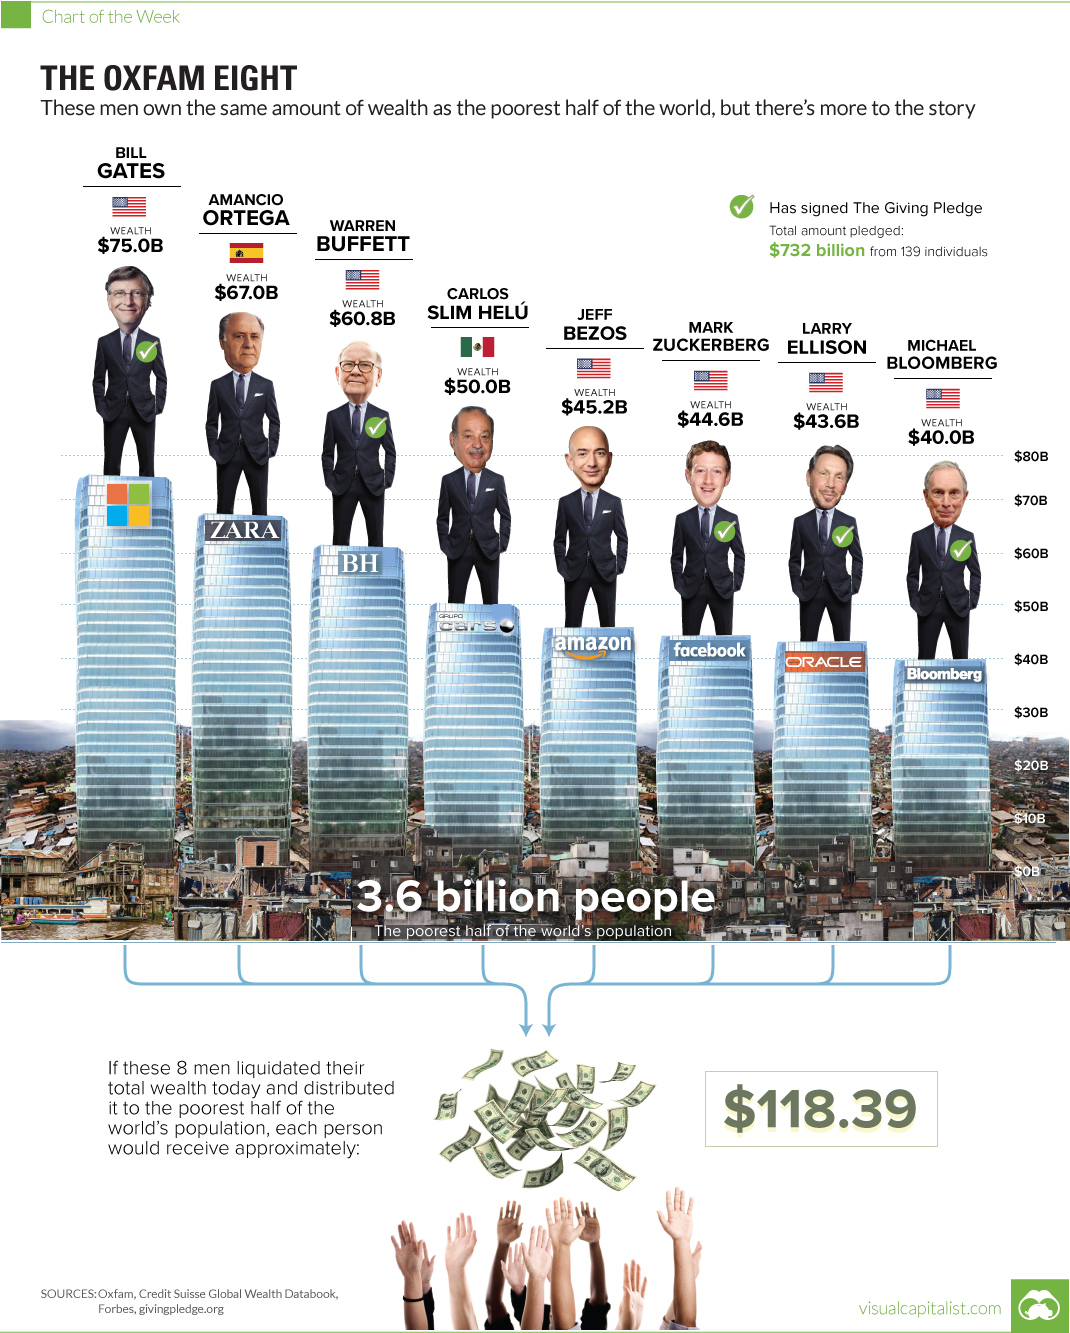
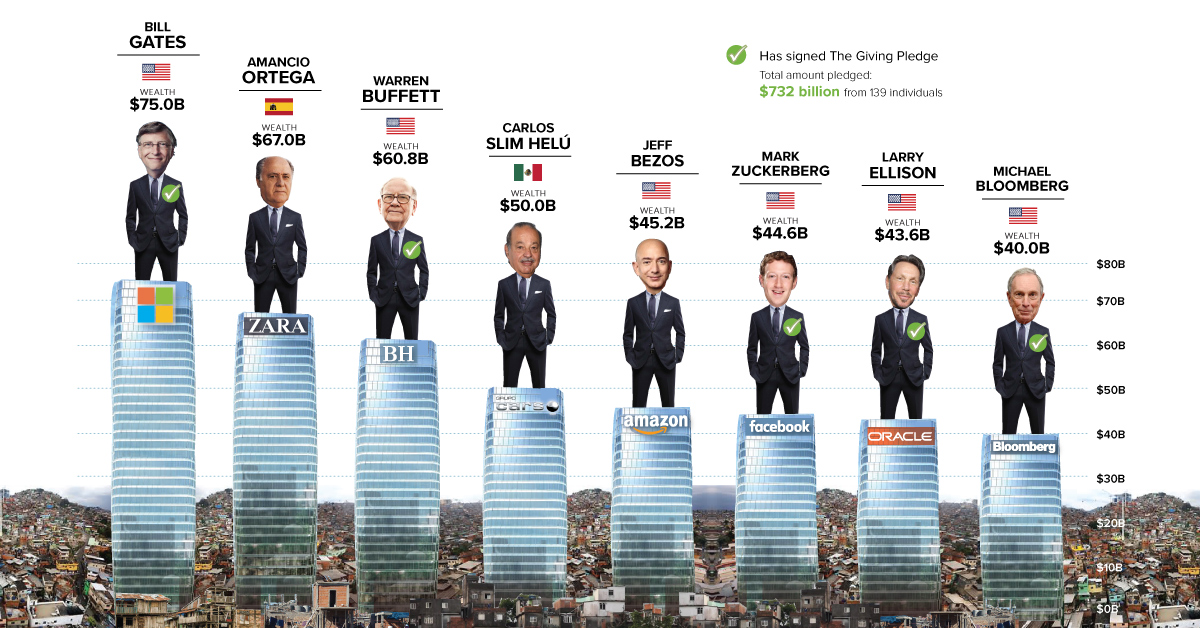
Prior to the opening day of the World Economic Forum in Davos, Oxfam International made waves with its latest report on global inequality. In particular, one “shock value” finding made headlines: eight men now combine to have the same wealth as half of the world’s population, or 3.6 billion people.
Today’s chart breaks down who these men are and how much they own in terms of assets. But, it also serves as a springboard to dive into a few other thoughts on the Oxfam report, inequality, philanthropy, and eradicating poverty.
The Giving Pledge
When I saw the headline from the Oxfam report, one of my first thoughts was: how many of these billionaires have signed The Giving Pledge?
The Giving Pledge was launched in 2010 by Bill and Melinda Gates and Warren Buffett. It’s stated goal is to “help address society’s most pressing problems” by inviting “the world’s wealthiest individuals and families to commit to giving more than half of their wealth to philanthropy”. So far, it’s been signed by 139 individuals with commitments of $732 billion.
Of the eight people at the top of the wealth pyramid, the majority has signed The Giving Pledge including: Bill Gates (co-founder), Warren Buffett (co-founder), Mark Zuckerberg, Larry Ellison, and Michael Bloomberg.
Three of the eight billionaires haven’t signed the pledge. Jeff Bezos is included in that mix, and he has faced some criticism over the fact. The other two that have not signed yet are Spanish billionaire Amancio Ortega and Mexican business magnate Carlos Slim Helú.
At the end of the day, signing the Giving Pledge is not yet equivalent to “walking the walk” in helping to solve pressing problems like poverty or inequality. However, people like Gates and Buffett have already made a huge difference to charitable causes.
Here’s what Warren Buffett recently said about his fortune:
In my entire lifetime, everything that I’ve spent will be quite a bit less than 1 percent of everything I make. The other 99 percent plus will go to others because it has no utility to me. So it’s silly for me to not transfer that utility to people who can use it.
Buffett is one of the world’s best investors – and if he continues to invest his money wisely into philanthropy, the result will likely be something that even Oxfam can be proud of.
The Poor Are Actually Getting Richer
While the sensational fact that headlined the Oxfam report is certainly alarming and important, it also misses some noteworthy context.
People in many of the world’s poorest nations aren’t getting poorer – they are actually getting much richer. The number of people living in extreme poverty has been cut in half since 1990.
Here’s another way to show it – and perhaps this is where the emotional pain points arise:
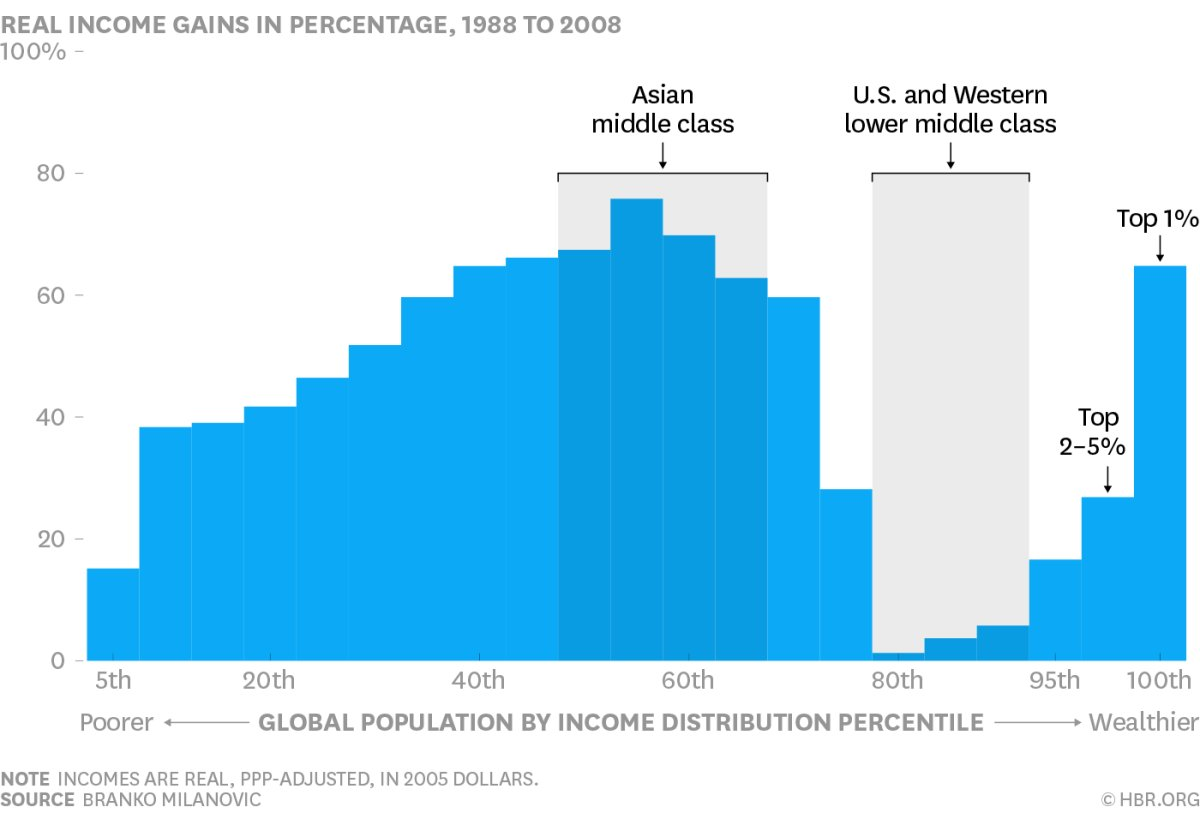
Courtesy of: Harvard Business Review, h/t Ian Bremmer
The poorest and richest cohorts of the global population, along with the Asian middle class, all got much richer over the last two decades.
The American middle class, however, was not so lucky. Median income for 81% of U.S. counties actually peaked back in 1999, and other Western countries are facing similar inequality challenges.
One Last Chart
The final chart here is courtesy of Swedish author and historian Johan Norberg, who wrote a sarcastic response to the Oxfam report:
If we don't end neoliberalism we'll see more of what happened in the last 25 years, warns Oxfam. pic.twitter.com/i1CH3dswFY
— Johan Norberg (@johanknorberg) January 17, 2017
Oxfam and many others are rightly concerned about inequality. But, for the people that need it most, things continue to get better. Such a narrative is not sexy enough for a click-driven media that thrives on sensational or emotional soundbites.
For more information about the metrics that are continuing to improve, see this post by Peter Diamandis, or this one in Reason.
Here’s one final quote from Norberg worth considering:
Part of our problem is one of success. As we get richer, our tolerance for global poverty diminishes. So we get angrier about injustices. Charities quite rightly wish to raise funds, so they draw our attention to the plight of the world’s poorest. But since the Cold War ended, extreme poverty has decreased from 37 per cent to 9.6 per cent — in single digits for the first time in history.


Money
Charted: Who Has Savings in This Economy?
Older, better-educated adults are winning the savings game, reveals a January survey by the National Opinion Research Center at the University of Chicago.


Who Has Savings in This Economy?
This was originally posted on our Voronoi app. Download the app for free on iOS or Android and discover incredible data-driven charts from a variety of trusted sources.
Two full years of inflation have taken their toll on American households. In 2023, the country’s collective credit card debt crossed $1 trillion for the first time. So who is managing to save money in the current economic environment?
We visualize the percentage of respondents to the statement “I have money leftover at the end of the month” categorized by age and education qualifications. Data is sourced from a National Endowment for Financial Education (NEFE) report, published last month.
The survey for NEFE was conducted from January 12-14, 2024, by the National Opinion Research Center at the University of Chicago. It involved 1,222 adults aged 18+ and aimed to be representative of the U.S. population.
Older Americans Save More Than Their Younger Counterparts
General trends from this dataset indicate that as respondents get older, a higher percentage of them are able to save.
| Age | Always/Often | Sometimes | Rarely/Never |
|---|---|---|---|
| 18–29 | 29% | 33% | 38% |
| 30–44 | 36% | 27% | 37% |
| 45–59 | 39% | 23% | 38% |
| Above 60 | 49% | 28% | 23% |
| All Adults | 39% | 33% | 27% |
Note: Percentages are rounded and may not sum to 100.
Perhaps not surprisingly, those aged 60+ are the age group with the highest percentage saying they have leftover money at the end of the month. This age group spent the most time making peak earnings in their careers, are more likely to have investments, and are more likely to have paid off major expenses like a mortgage or raising a family.
The Impact of Higher Education on Earnings and Savings
Based on this survey, higher education dramatically improves one’s ability to save. Shown in the table below, those with a bachelor’s degree or higher are three times more likely to have leftover money than those without a high school diploma.
| Education | Always/Often | Sometimes | Rarely/Never |
|---|---|---|---|
| No HS Diploma | 18% | 26% | 56% |
| HS Diploma | 28% | 33% | 39% |
| Associate Degree | 33% | 31% | 36% |
| Bachelor/Higher Degree | 59% | 21% | 20% |
| All Adults | 39% | 33% | 27% |
Note: Percentages are rounded and may not sum to 100.
As the Bureau of Labor Statistics notes, earnings improve with every level of education completed.
For example, those with a high school diploma made 25% more than those without in 2022. And as the qualifications increase, the effects keep stacking.
Meanwhile, a Federal Reserve study also found that those with more education tended to make financial decisions that contributed to building wealth, of which the first step is to save.

-

 Green1 week ago
Ranked: The Countries With the Most Air Pollution in 2023
-

 Automotive2 weeks ago
Almost Every EV Stock is Down After Q1 2024
-

 AI2 weeks ago
The Stock Performance of U.S. Chipmakers So Far in 2024
-

 Markets2 weeks ago
Charted: Big Four Market Share by S&P 500 Audits
-

 Real Estate2 weeks ago
Ranked: The Most Valuable Housing Markets in America
-

 Money2 weeks ago
Which States Have the Highest Minimum Wage in America?
-

 AI2 weeks ago
Ranked: Semiconductor Companies by Industry Revenue Share
-

 Travel2 weeks ago
Ranked: The World’s Top Flight Routes, by Revenue