Mapped: The 10 U.S. States With the Lowest Real GDP Growth
Ranked: The World’s 50 Largest Private Equity Firms
Top 10 Countries Most in Debt to the IMF
Ranked: The Top 6 Economies by Share of Global GDP (1980-2024)
Mapped: Europe’s GDP Per Capita, by Country
Countries With the Highest Rates of Crypto Ownership
Mapped: The Number of AI Startups By Country
All of the Grants Given by the U.S. CHIPS Act
Visualizing AI Patents by Country
How Tech Logos Have Evolved Over Time
Visualizing America’s Average Retirement Savings, by Age
Visualizing the Tax Burden of Every U.S. State
Charted: What Frustrates Americans About the Tax System
Ranked: The Top 20 Countries in Debt to China
Mapped: Countries Where Recreational Cannabis is Legal
Which Countries Have the Highest Infant Mortality Rates?
Life Expectancy by Region (1950-2050F)
What Causes Preventable Child Deaths?
The Cost of an EpiPen in Major Markets
Who’s Building the Most Solar Energy?
Mapped: The Age of Energy Projects in Interconnection Queues, by State
Ranked: The Top 10 EV Battery Manufacturers in 2023
The World’s Biggest Nuclear Energy Producers
The World’s Biggest Oil Producers in 2023
Mapped: The Top Exports in Asian Countries
Mapped: U.S. States By Number of Cities Over 250,000 Residents
Mapped: U.S. Immigrants by Region
The Biggest Salt Producing Countries in 2023
Visualizing Copper Production by Country in 2023
Where the World’s Aluminum is Smelted, by Country
Visualizing Global Gold Production in 2023
How People Get Around in America, Europe, and Asia
The Carbon Footprint of Major Travel Methods
Ranking the Top 15 Countries by Carbon Tax Revenue
Ranked: The Countries With the Most Air Pollution in 2023
Top Countries By Forest Growth Since 2001
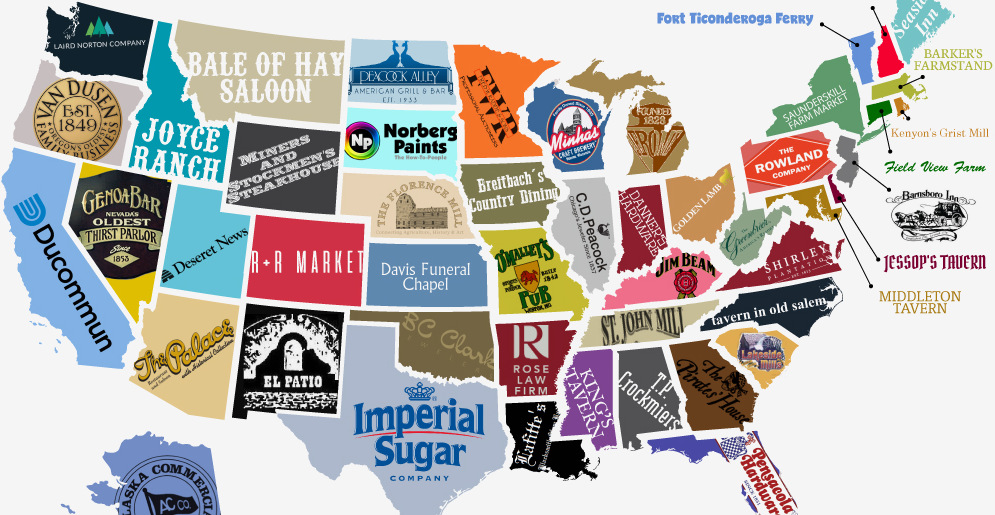
Is the oldest business in your state a well-known brand, or a mom-and-pop shop? This infographic shows the oldest company in each state in the U.S.
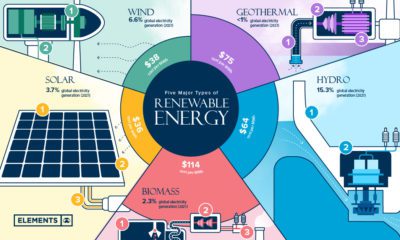
Renewable energy is the foundation of the ongoing energy transition. What are the key types of renewable energy, and how do they work?
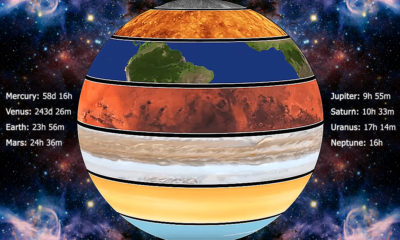
Rotation can have a big influence on a planet's habitability. These animations show how each planet in the solar system moves to its own distinct rhythm.
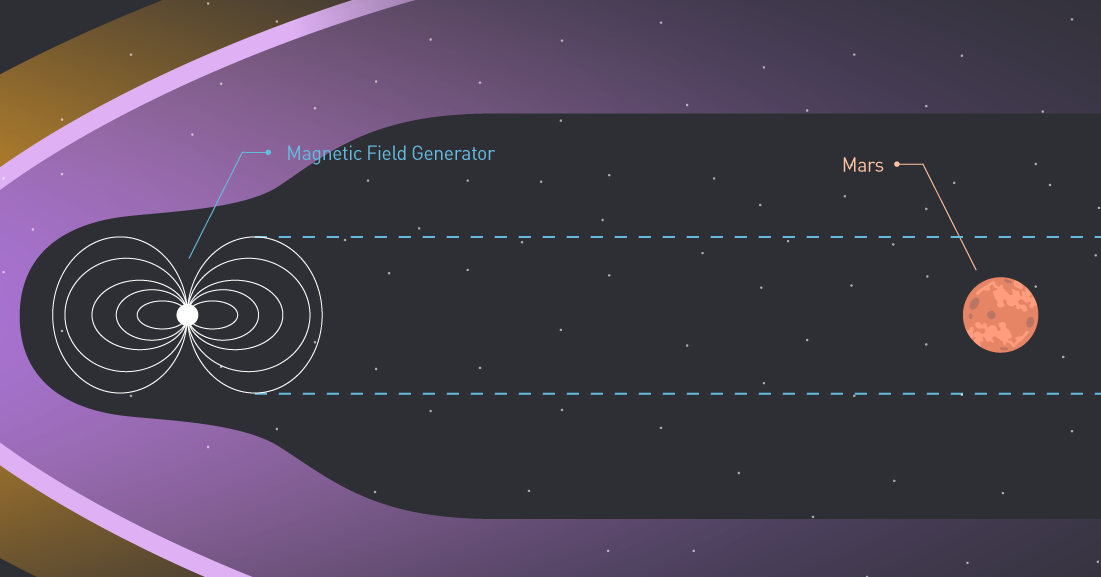
This infographic highlights some of the major problems we'd need to solve to make other planets like Mars more hospitable to human life.
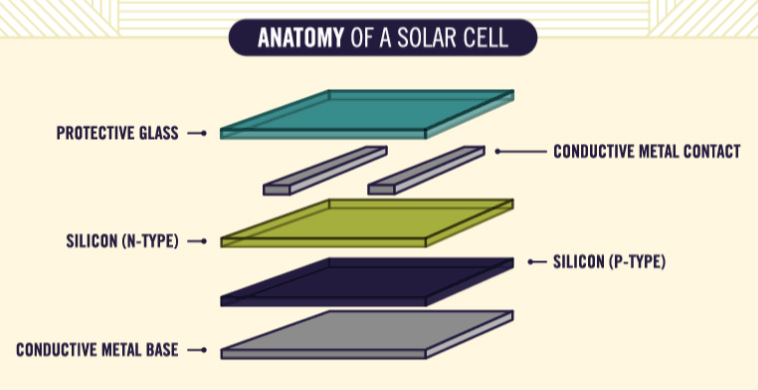
Ever wonder how solar panels work to generate electricity? This animated infographic explains the science behind it, making it easy to understand for anyone.
In this visualization, we rank the top 50 websites that receive the most internet traffic, from Google to CNN.
Why is payments startup Stripe worth $9B? Partly, because it's made it so easy to tap into the backend, allowing the creation of a massive Stripe...
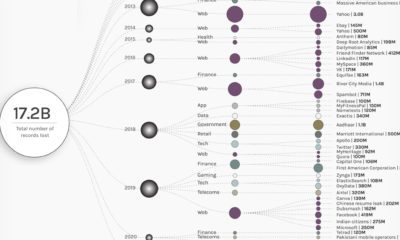
In 2021, more than 5.9 billion user records were stolen. This graphic visualizes the 50 largest data breaches, by entity and sector, since 2004.
In some cases, COVID-19 has sped up societal and economic trends that were already in motion. Here we examine five examples.
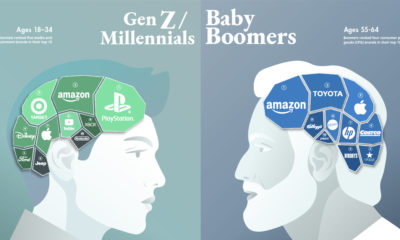
Can a brand transcend time and be all things to all people? This graphic seeks to find out by visualizing the most loved brands by generation.


 Creator Program