Mapped: The 10 U.S. States With the Lowest Real GDP Growth
Ranked: The World’s 50 Largest Private Equity Firms
Top 10 Countries Most in Debt to the IMF
Ranked: The Top 6 Economies by Share of Global GDP (1980-2024)
Mapped: Europe’s GDP Per Capita, by Country
Countries With the Highest Rates of Crypto Ownership
Mapped: The Number of AI Startups By Country
All of the Grants Given by the U.S. CHIPS Act
Visualizing AI Patents by Country
How Tech Logos Have Evolved Over Time
Visualizing America’s Average Retirement Savings, by Age
Visualizing the Tax Burden of Every U.S. State
Charted: What Frustrates Americans About the Tax System
Ranked: The Top 20 Countries in Debt to China
Mapped: Countries Where Recreational Cannabis is Legal
Which Countries Have the Highest Infant Mortality Rates?
Life Expectancy by Region (1950-2050F)
What Causes Preventable Child Deaths?
The Cost of an EpiPen in Major Markets
Who’s Building the Most Solar Energy?
Mapped: The Age of Energy Projects in Interconnection Queues, by State
Ranked: The Top 10 EV Battery Manufacturers in 2023
The World’s Biggest Nuclear Energy Producers
The World’s Biggest Oil Producers in 2023
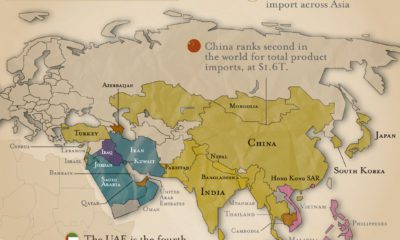
Mapped: The Top Exports in Asian Countries
Mapped: U.S. States By Number of Cities Over 250,000 Residents
Mapped: U.S. Immigrants by Region
The Biggest Salt Producing Countries in 2023
Visualizing Copper Production by Country in 2023
Where the World’s Aluminum is Smelted, by Country
Visualizing Global Gold Production in 2023
How People Get Around in America, Europe, and Asia
The Carbon Footprint of Major Travel Methods
Ranking the Top 15 Countries by Carbon Tax Revenue
Ranked: The Countries With the Most Air Pollution in 2023
Top Countries By Forest Growth Since 2001
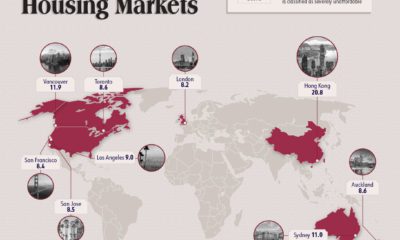
For the 10th consecutive year, Hong Kong ranks as the least affordable city. Vancouver Canada is the second, followed by Sydney, Australia.
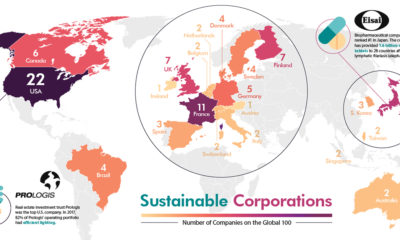
The world's most sustainable corporations have a monumental impact on social and environmental issues. See where they are located in this visualization.
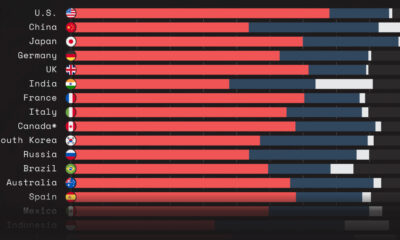
This graphic shows GDP by country, broken down into three main sectors: services, industry, and agriculture.
What are the top imports across Asia? Petroleum is the most popular import, followed by vehicles and electronic integrated circuits.
We count down our favorite infographics and charts from the year, including many you may not have seen before. Catch some of our best work in...
Will global GDP growth continue to be resilient in 2024? This graphic shows the economic outlook for 191 economies around the world.
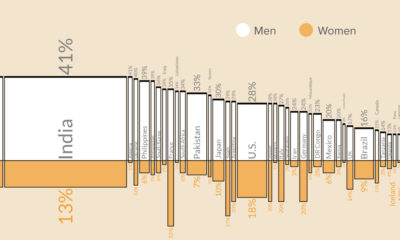
This graphic shows what percentage of men versus women are smokers in the 50 most populous countries worldwide.
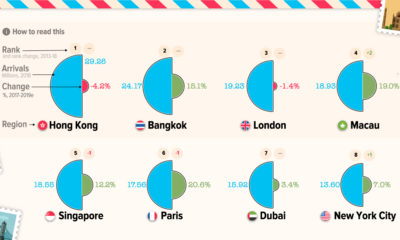
Even a pandemic can't curb wanderlust—when tourism comes back, here are the most popular city destinations that will be seeing visitors.
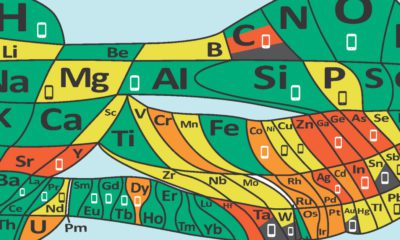
90 different elements form the building blocks for everything on Earth. Some are being used up, and soon could be endangered.
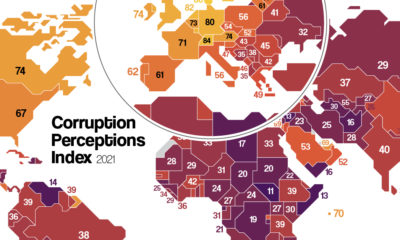
Which countries are the most (and least) corrupt? This map shows corruption around the world, and the movers and shakers over the last decade.


 Creator Program