Mapped: The 10 U.S. States With the Lowest Real GDP Growth
Ranked: The World’s 50 Largest Private Equity Firms
Top 10 Countries Most in Debt to the IMF
Ranked: The Top 6 Economies by Share of Global GDP (1980-2024)
Mapped: Europe’s GDP Per Capita, by Country
Countries With the Highest Rates of Crypto Ownership
Mapped: The Number of AI Startups By Country
All of the Grants Given by the U.S. CHIPS Act
Visualizing AI Patents by Country
How Tech Logos Have Evolved Over Time
Visualizing America’s Average Retirement Savings, by Age
Visualizing the Tax Burden of Every U.S. State
Charted: What Frustrates Americans About the Tax System
Ranked: The Top 20 Countries in Debt to China
Mapped: Countries Where Recreational Cannabis is Legal
Which Countries Have the Highest Infant Mortality Rates?
Life Expectancy by Region (1950-2050F)
What Causes Preventable Child Deaths?
The Cost of an EpiPen in Major Markets
Who’s Building the Most Solar Energy?
Mapped: The Age of Energy Projects in Interconnection Queues, by State
Ranked: The Top 10 EV Battery Manufacturers in 2023
The World’s Biggest Nuclear Energy Producers
The World’s Biggest Oil Producers in 2023
Mapped: The Top Exports in Asian Countries
Mapped: U.S. States By Number of Cities Over 250,000 Residents
Mapped: U.S. Immigrants by Region
The Biggest Salt Producing Countries in 2023
Visualizing Copper Production by Country in 2023
Where the World’s Aluminum is Smelted, by Country
Visualizing Global Gold Production in 2023
How People Get Around in America, Europe, and Asia
The Carbon Footprint of Major Travel Methods
Ranking the Top 15 Countries by Carbon Tax Revenue
Ranked: The Countries With the Most Air Pollution in 2023
Top Countries By Forest Growth Since 2001
This graphic explores 20 years of Nintendo console sales and the success of the Nintendo Switch.
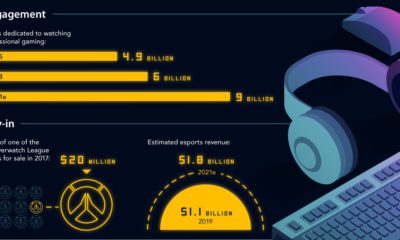
This infographic plots the journey of esports, from underground niche to a billion-dollar mainstream phenomenon—and it shows no signs of slowing down.
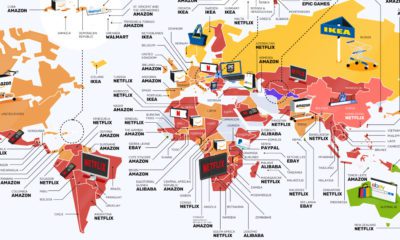
From Netflix to IKEA, this map of the world highlights the most searched for consumer brands around the world.
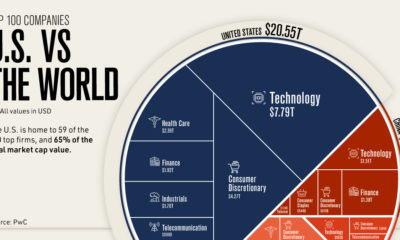
Where are the top 100 companies of the world located? We highlight the U.S. share of the top companies by market capitalization .
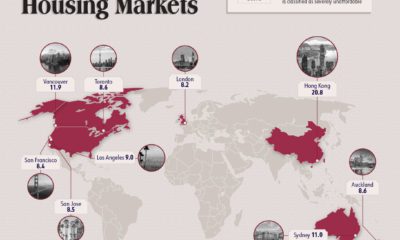
For the 10th consecutive year, Hong Kong ranks as the least affordable city. Vancouver Canada is the second, followed by Sydney, Australia.
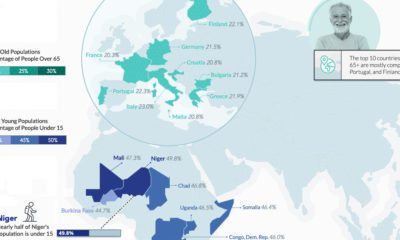
Higher life expectancies and lower fertility rates are reshaping global demographics, but vast regional differences remain. Where are the youngest and oldest countries in the world?
This graphic breaks down Microsoft's revenue by segment—from cloud office software to AI search engine capabilities in 2023.
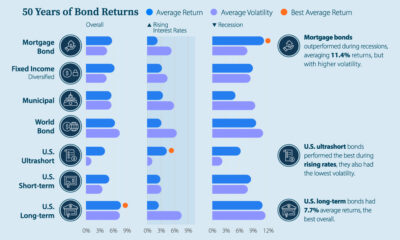
What factors impact the bond market? Here's how current interest rates, bond returns, and market volatility compare in a historical context.
The history of Europe is breathtakingly complex, but this animation helps makes sense of 2,400 years of change on the European map.
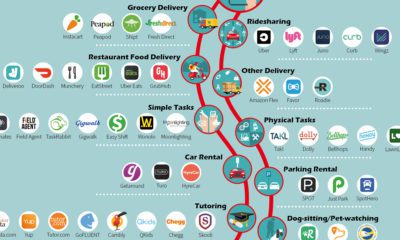
You're likely familiar with companies like Uber, Airbnb, and Craigslist, but here are 100+ other apps that help make the gig economy possible.


 Creator Program