Mapped: The 10 U.S. States With the Lowest Real GDP Growth
Ranked: The World’s 50 Largest Private Equity Firms
Top 10 Countries Most in Debt to the IMF
Ranked: The Top 6 Economies by Share of Global GDP (1980-2024)
Mapped: Europe’s GDP Per Capita, by Country
Countries With the Highest Rates of Crypto Ownership
Mapped: The Number of AI Startups By Country
All of the Grants Given by the U.S. CHIPS Act
Visualizing AI Patents by Country
How Tech Logos Have Evolved Over Time
Visualizing America’s Average Retirement Savings, by Age
Visualizing the Tax Burden of Every U.S. State
Charted: What Frustrates Americans About the Tax System
Ranked: The Top 20 Countries in Debt to China
Mapped: Countries Where Recreational Cannabis is Legal
Which Countries Have the Highest Infant Mortality Rates?
Life Expectancy by Region (1950-2050F)
What Causes Preventable Child Deaths?
The Cost of an EpiPen in Major Markets
Who’s Building the Most Solar Energy?
Mapped: The Age of Energy Projects in Interconnection Queues, by State
Ranked: The Top 10 EV Battery Manufacturers in 2023
The World’s Biggest Nuclear Energy Producers
The World’s Biggest Oil Producers in 2023
Mapped: The Top Exports in Asian Countries
Mapped: U.S. States By Number of Cities Over 250,000 Residents
Mapped: U.S. Immigrants by Region
The Biggest Salt Producing Countries in 2023
Visualizing Copper Production by Country in 2023
Where the World’s Aluminum is Smelted, by Country
Visualizing Global Gold Production in 2023
How People Get Around in America, Europe, and Asia
The Carbon Footprint of Major Travel Methods
Ranking the Top 15 Countries by Carbon Tax Revenue
Ranked: The Countries With the Most Air Pollution in 2023
Top Countries By Forest Growth Since 2001
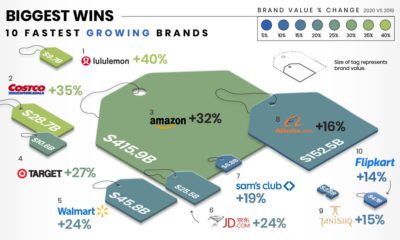
This infographic illustrates how the fastest growing and declining retail brands are attempting to stay relevant in the pandemic economy.
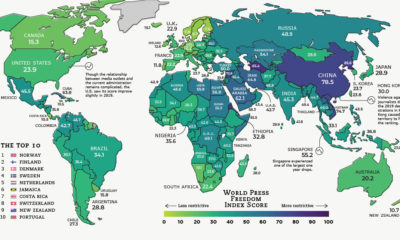
Global press freedom improved slightly in 2019, but censorship, intimidation, and violence remain a fact of life for many journalists around the world.
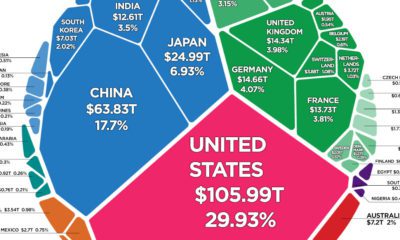
There is $360.6 trillion of wealth globally. This graphic shows how it breaks down by country, to show who owns all of the world's wealth.
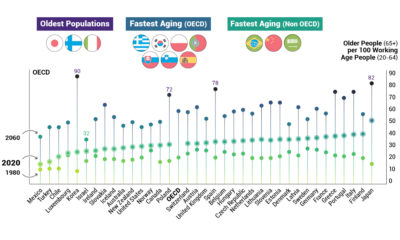
The data behind the world's rapidly aging population, and what it could mean for the economy and future generations of retirees.
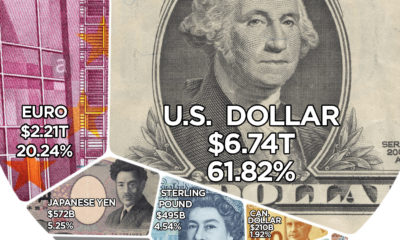
Here are the reserve currencies that the world's central banks hold onto for a rainy day.
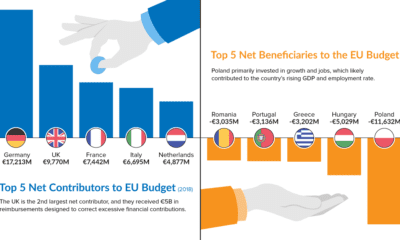
As Brexit looms, the EU budget is under the microscope. Learn which countries contribute the most—and least—to the bottom line in this chart.
A collection of the best Warren Buffett quotes, accompanied with illustrations, to close out our infographic series on the famous investor.
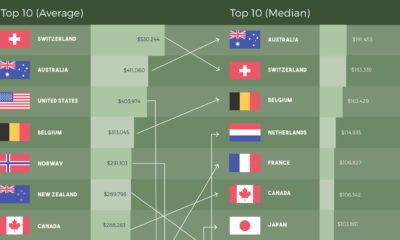
How do the rankings of the world's most affluent countries change when using different metrics to measure wealth per capita?
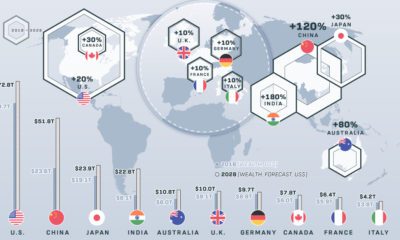
These 10 countries hold 74% of the world's $204 trillion in private wealth. How will this wealth of nations change over the next decade?
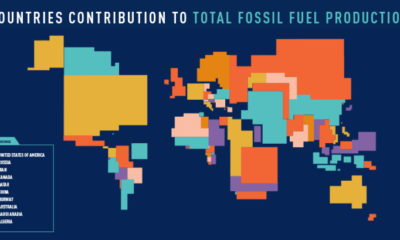
These four animated cartograms show the nations leading the world in fossil fuel production, in terms of oil, gas, coal, and total hydrocarbons.