Mapped: The 10 U.S. States With the Lowest Real GDP Growth
Ranked: The World’s 50 Largest Private Equity Firms
Top 10 Countries Most in Debt to the IMF
Ranked: The Top 6 Economies by Share of Global GDP (1980-2024)
Mapped: Europe’s GDP Per Capita, by Country
Countries With the Highest Rates of Crypto Ownership
Mapped: The Number of AI Startups By Country
All of the Grants Given by the U.S. CHIPS Act
Visualizing AI Patents by Country
How Tech Logos Have Evolved Over Time
Visualizing America’s Average Retirement Savings, by Age
Visualizing the Tax Burden of Every U.S. State
Charted: What Frustrates Americans About the Tax System
Ranked: The Top 20 Countries in Debt to China
Mapped: Countries Where Recreational Cannabis is Legal
Which Countries Have the Highest Infant Mortality Rates?
Life Expectancy by Region (1950-2050F)
What Causes Preventable Child Deaths?
The Cost of an EpiPen in Major Markets
Who’s Building the Most Solar Energy?
Mapped: The Age of Energy Projects in Interconnection Queues, by State
Ranked: The Top 10 EV Battery Manufacturers in 2023
The World’s Biggest Nuclear Energy Producers
The World’s Biggest Oil Producers in 2023
Mapped: The Top Exports in Asian Countries
Mapped: U.S. States By Number of Cities Over 250,000 Residents
Mapped: U.S. Immigrants by Region
The Biggest Salt Producing Countries in 2023
Visualizing Copper Production by Country in 2023
Where the World’s Aluminum is Smelted, by Country
Visualizing Global Gold Production in 2023
How People Get Around in America, Europe, and Asia
The Carbon Footprint of Major Travel Methods
Ranking the Top 15 Countries by Carbon Tax Revenue
Ranked: The Countries With the Most Air Pollution in 2023
Top Countries By Forest Growth Since 2001
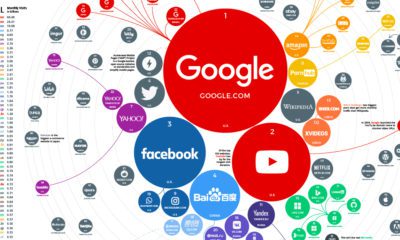
The top 100 websites ranking reveals how people around the world search for information, which services they use, and how they spend time online.
What does a road map of the world look like? Here’s a deep view of roads visualized by type across countries and continents.
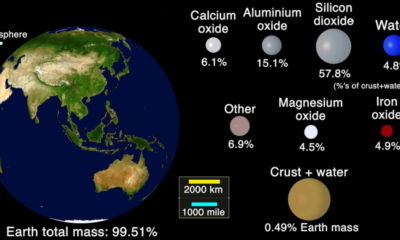
This animation shows the handful of minerals and elements that constitute the Earth's crust.
Telcos failed to capitalize on the 'Netflix' opportunity — however, the birth of a new multi-billion dollar industry (esports) could change the game.
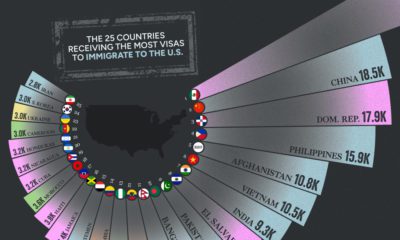
Every year, there are hundreds of thousands of U.S. immigration visas issued by the government. See which countries receive the most in this visualization.
Analyzing 2023 per capita GDP numbers from the International Monetary Fund lets us know where the richest countries in the world are.
This unique map graphic uses the Great Lakes region as a point of comparison for the top 25 largest lakes in the world.
This infographic shows countries with the most billionaires, as well as the richest one in each country. Also, the odds of meeting a billionaire in each...
Get a head start on what's to come in 2023. Join VC+ to gain access to our 2023 Global Forecast Series and other exclusive insights!
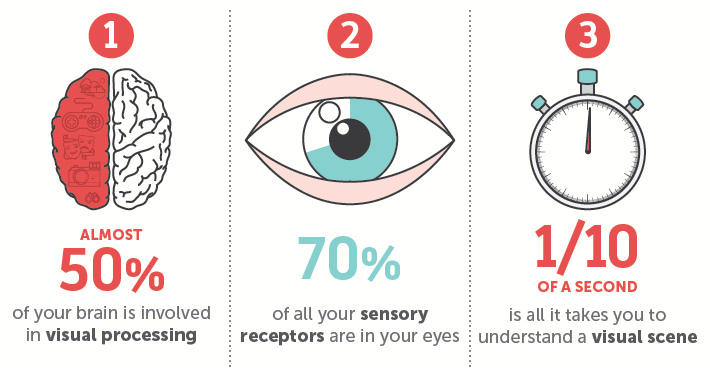
Why are our brains addicted to visually stimulating content such as infographics or charts? Here's the scientific evidence behind why we crave visuals.


 Creator Program