Mapped: The 10 U.S. States With the Lowest Real GDP Growth
Ranked: The World’s 50 Largest Private Equity Firms
Top 10 Countries Most in Debt to the IMF
Ranked: The Top 6 Economies by Share of Global GDP (1980-2024)
Mapped: Europe’s GDP Per Capita, by Country
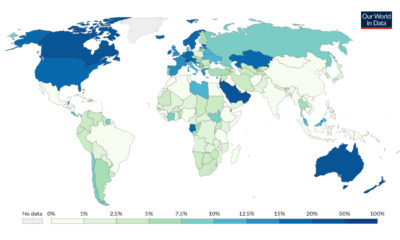
Countries With the Highest Rates of Crypto Ownership
Mapped: The Number of AI Startups By Country
All of the Grants Given by the U.S. CHIPS Act
Visualizing AI Patents by Country
How Tech Logos Have Evolved Over Time
Visualizing America’s Average Retirement Savings, by Age
Visualizing the Tax Burden of Every U.S. State
Charted: What Frustrates Americans About the Tax System
Ranked: The Top 20 Countries in Debt to China
Mapped: Countries Where Recreational Cannabis is Legal
Which Countries Have the Highest Infant Mortality Rates?
Life Expectancy by Region (1950-2050F)
What Causes Preventable Child Deaths?
The Cost of an EpiPen in Major Markets
Who’s Building the Most Solar Energy?
Mapped: The Age of Energy Projects in Interconnection Queues, by State
Ranked: The Top 10 EV Battery Manufacturers in 2023
The World’s Biggest Nuclear Energy Producers
The World’s Biggest Oil Producers in 2023
Mapped: The Top Exports in Asian Countries
Mapped: U.S. States By Number of Cities Over 250,000 Residents
Mapped: U.S. Immigrants by Region
The Biggest Salt Producing Countries in 2023
Visualizing Copper Production by Country in 2023
Where the World’s Aluminum is Smelted, by Country
Visualizing Global Gold Production in 2023
How People Get Around in America, Europe, and Asia
The Carbon Footprint of Major Travel Methods
Ranking the Top 15 Countries by Carbon Tax Revenue
Ranked: The Countries With the Most Air Pollution in 2023
Top Countries By Forest Growth Since 2001
Immigrants account for 3.5% of the global population, but where are they more or less prevalent? This map shows immigration by country.
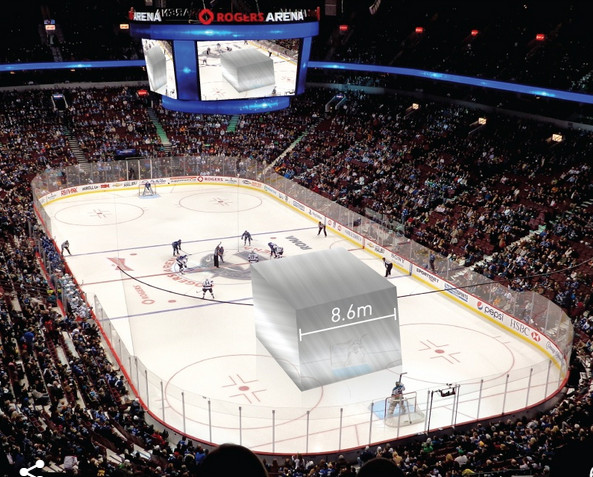
https://beta.quiet.ly/list/share/8dc7b-a-year-s-worth-of-resources-in-bc?width=796&height=0&showGradient=false&showMapView=false&showAuthor=false&showLogo=true&showListTitle=true&showListDescription=true&showTitles=true&showDescriptions=true&showWeblinks=true&makeClickable=true&sharePage=true&showIcons=true&embedTheme=dark&titleSize=18&titleType=quietly&descriptionSize=14&descriptionType=quietly&useOriginalImages=true&lastSlide=default&lastSlideMsg=&lastSlideUrl=http%3A%2F%2Fwww.facebook.com%2Fvisualcapitalist A Year’s Worth of Resources in British Columbia Earlier this month, we created a slideshow visualizing the amount of metal and oil extracted globally with...
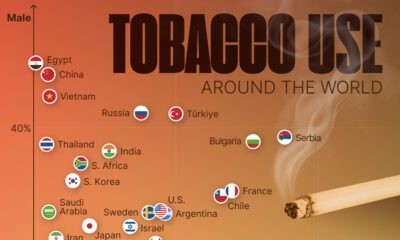
This visual shows tobacco use by country and sex, highlighting which countries still have a high prevalence of smoking.
In this visual, we've ranked the top U.S. metropolitan areas in terms of their GDP. How does your city rank?
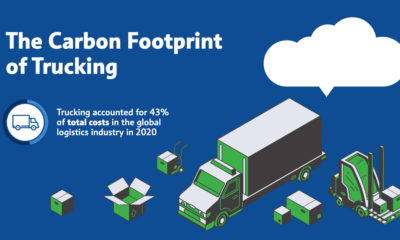
The impact of booming ecommerce and international trade on trucking's carbon footprint and GHG emissions is heavy—but there are solutions.
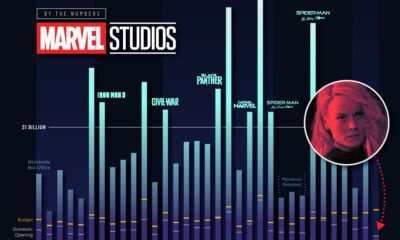
How poorly did 'The Marvels' perform in its opening weekend, and how do other Marvel box office returns compare?
The story of how Vancouver lost its affordability...and its mind.
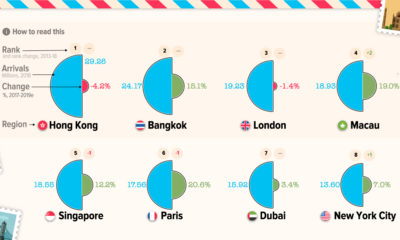
Even a pandemic can't curb wanderlust—when tourism comes back, here are the most popular city destinations that will be seeing visitors.
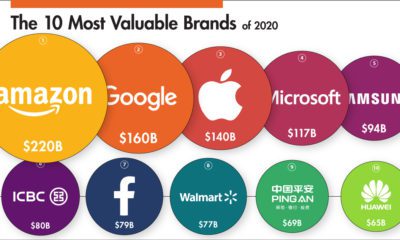
This infographic ranks some of the world’s biggest companies by brand value in 2020 and visualizes the movers and shakers over the past year.
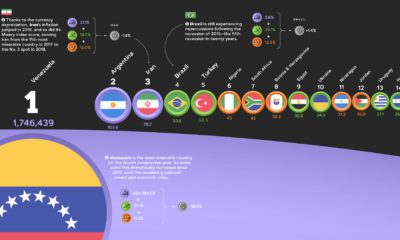
The annual Misery Index ranks the most and least miserable countries, based on four economic factors—unemployment, inflation, lending rates, and GDP growth.


 Creator Program