Mapped: The 10 U.S. States With the Lowest Real GDP Growth
Ranked: The World’s 50 Largest Private Equity Firms
Top 10 Countries Most in Debt to the IMF
Ranked: The Top 6 Economies by Share of Global GDP (1980-2024)
Mapped: Europe’s GDP Per Capita, by Country
Countries With the Highest Rates of Crypto Ownership
Mapped: The Number of AI Startups By Country
All of the Grants Given by the U.S. CHIPS Act
Visualizing AI Patents by Country
How Tech Logos Have Evolved Over Time
Visualizing America’s Average Retirement Savings, by Age
Visualizing the Tax Burden of Every U.S. State
Charted: What Frustrates Americans About the Tax System
Ranked: The Top 20 Countries in Debt to China
Mapped: Countries Where Recreational Cannabis is Legal
Which Countries Have the Highest Infant Mortality Rates?
Life Expectancy by Region (1950-2050F)
What Causes Preventable Child Deaths?
The Cost of an EpiPen in Major Markets
Who’s Building the Most Solar Energy?
Mapped: The Age of Energy Projects in Interconnection Queues, by State
Ranked: The Top 10 EV Battery Manufacturers in 2023
The World’s Biggest Nuclear Energy Producers
The World’s Biggest Oil Producers in 2023
Mapped: The Top Exports in Asian Countries
Mapped: U.S. States By Number of Cities Over 250,000 Residents
Mapped: U.S. Immigrants by Region
The Biggest Salt Producing Countries in 2023
Visualizing Copper Production by Country in 2023
Where the World’s Aluminum is Smelted, by Country
Visualizing Global Gold Production in 2023
How People Get Around in America, Europe, and Asia
The Carbon Footprint of Major Travel Methods
Ranking the Top 15 Countries by Carbon Tax Revenue
Ranked: The Countries With the Most Air Pollution in 2023
Top Countries By Forest Growth Since 2001
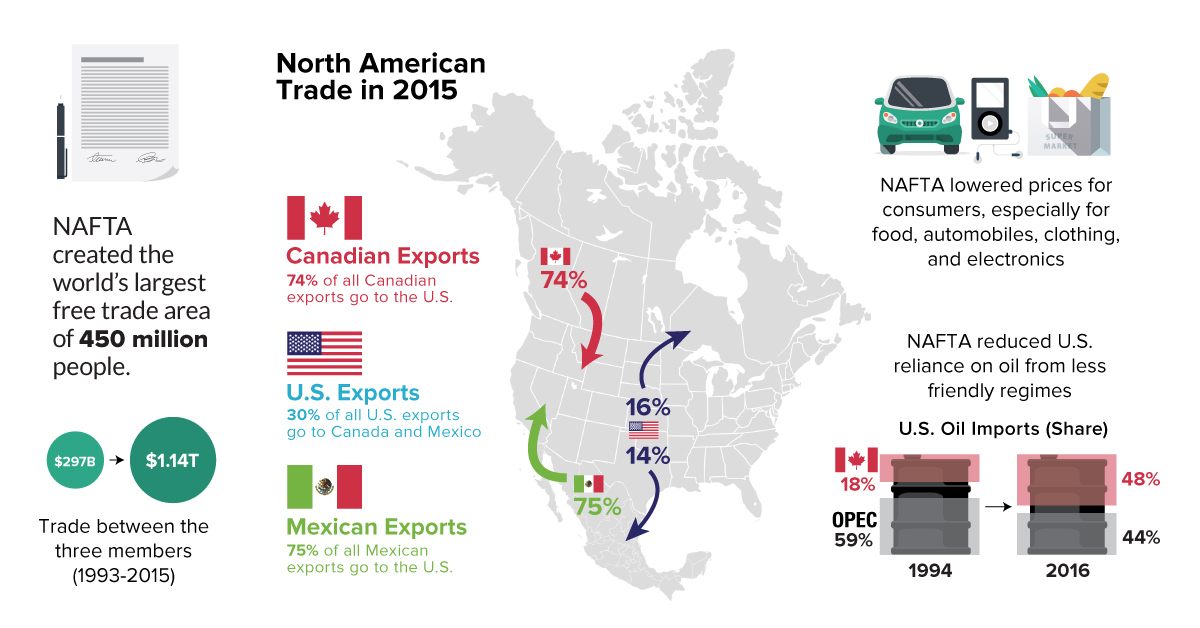
Everything you need to know about NAFTA, including a comparison of economic numbers before and since the agreement was signed in 1994.
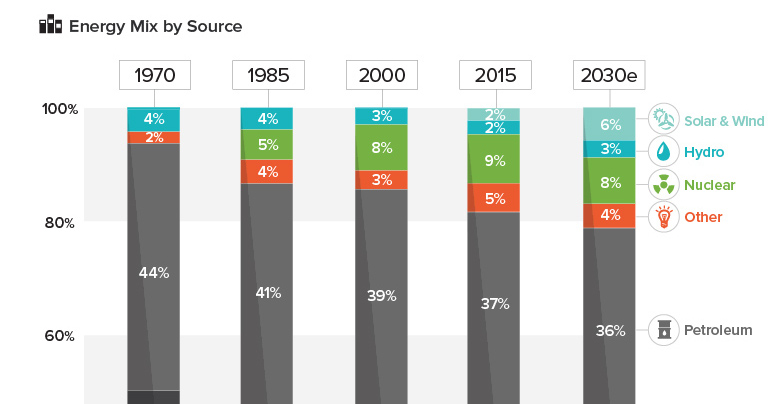
See how America's energy mix has evolved from 1970 until today, as well as a projection for the energy sources to be used in the year...
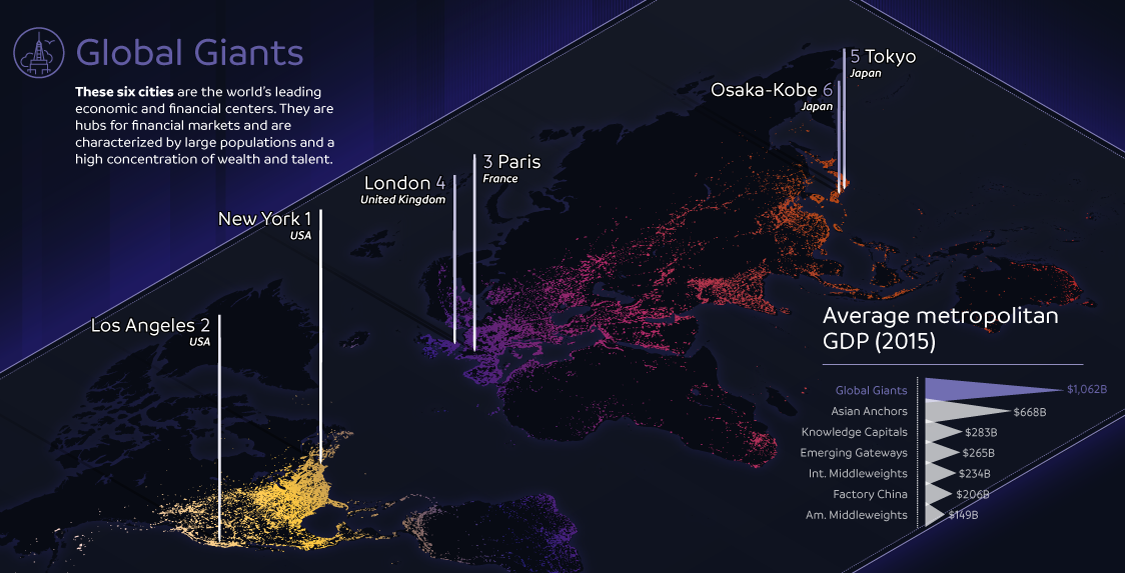
The world's largest 123 cities generate an astonishing $36 trillion in GDP per year. This infographic breaks these global cities down into seven typologies.
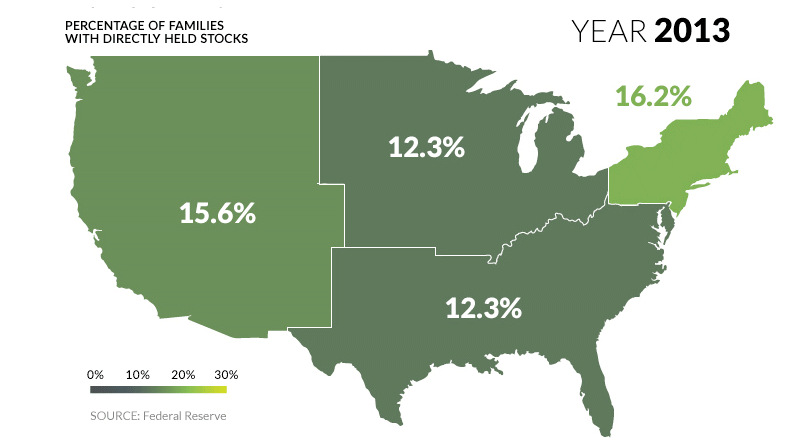
U.S. markets continue to hit all-time highs, but what percentage of population actually benefits? See stock ownership across the U.S. on this animated map.
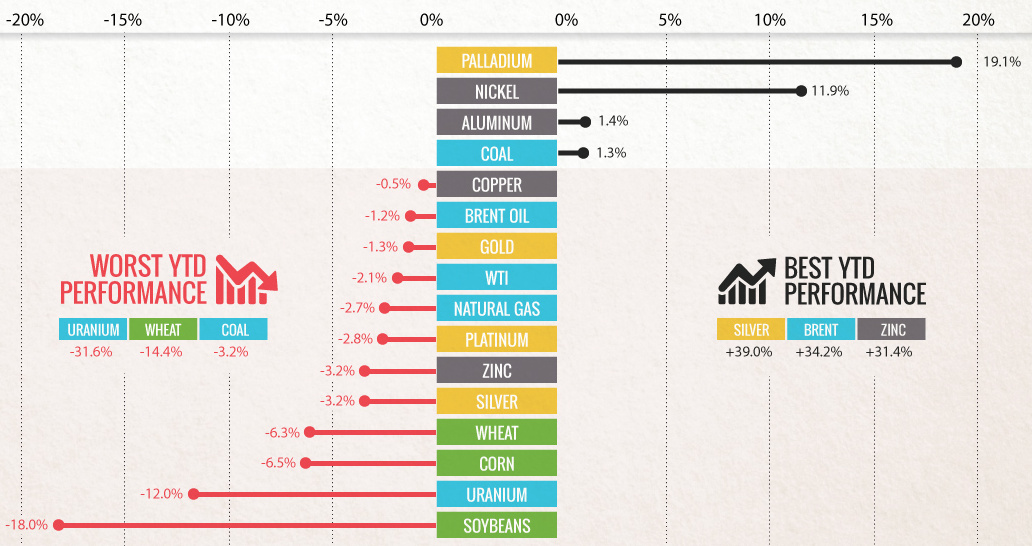
Commodities slumped in Q3 as buyers 'sold in May and went away'. Can commodities shake the summer slump with a U.S. election and OPEC deal in...
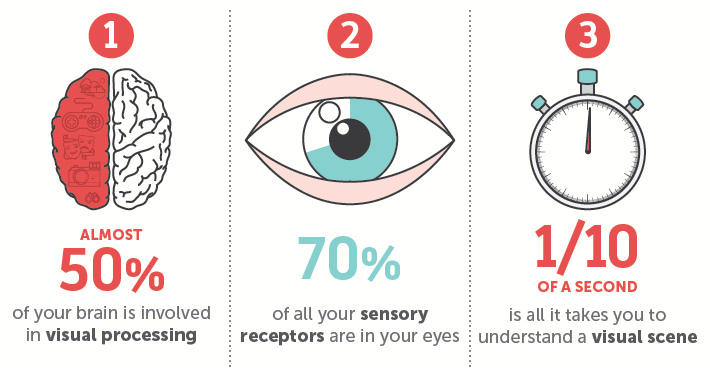
Why are our brains addicted to visually stimulating content such as infographics or charts? Here's the scientific evidence behind why we crave visuals.
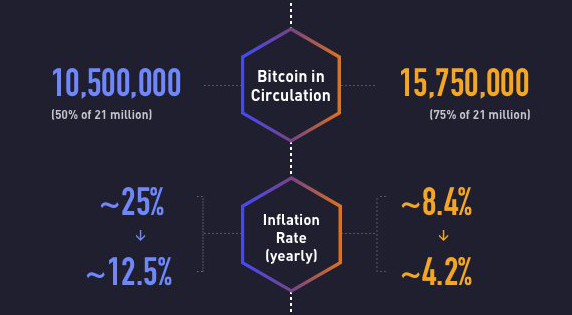
On July 9, 2016, the bitcoin halving event cut the rewards for mining in half. Today's infographic explores the progress of bitcoin since the last halving.
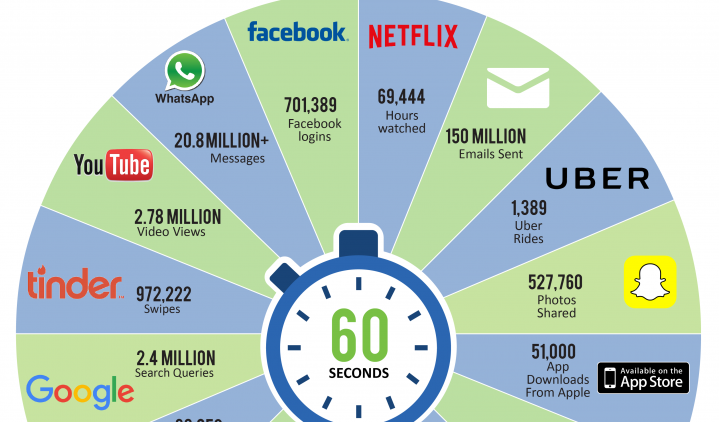
Here's the mind-boggling amount of Google searches, Uber rides, and Facebook logins happen in an internet minute in 2016.
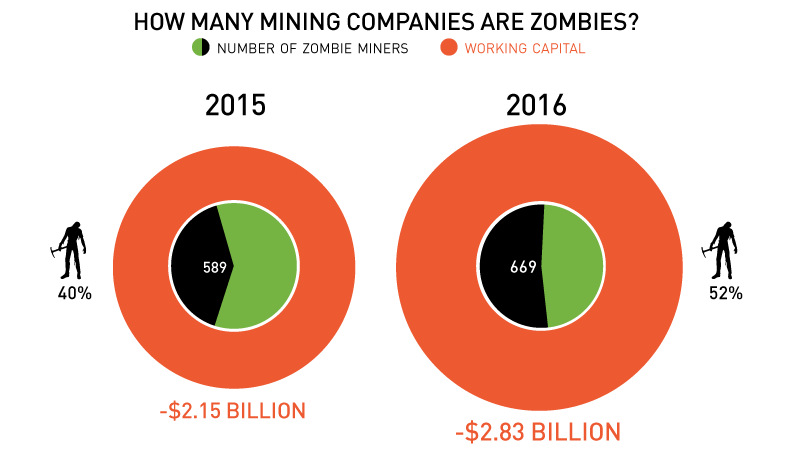
Mind-blowing fact: 52% of Canadian-listed mining companies are now considered "zombies", or companies with negative working capital.
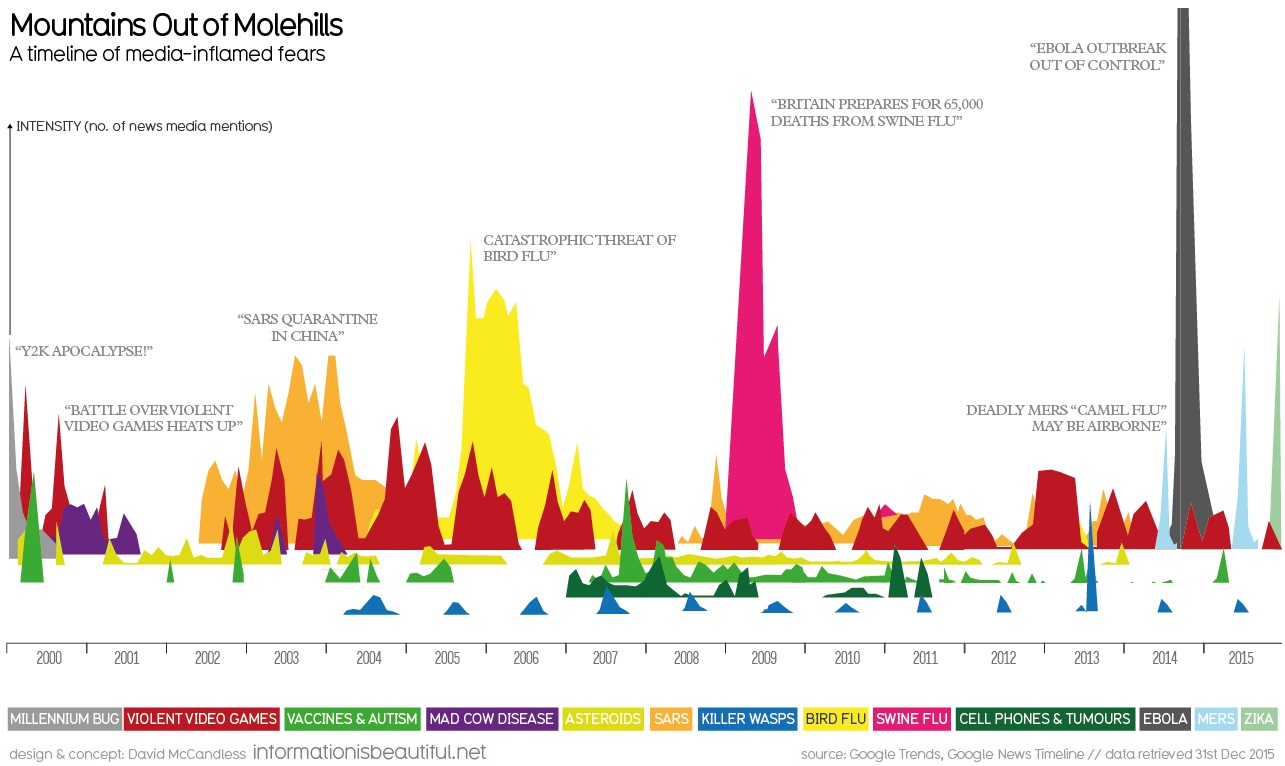
Each year, the media claims there to be a new virus or disaster that will threaten humankind. This data shows this coverage tends to be blown...