Which Retailers Operate in the Most Countries?
Mapped: The 10 U.S. States With the Lowest Real GDP Growth
Ranked: The World’s 50 Largest Private Equity Firms
Top 10 Countries Most in Debt to the IMF
Ranked: The Top 6 Economies by Share of Global GDP (1980-2024)
Ranked: The Top Startup Cities Around the World
Visualizing the 5 Most Common Cybersecurity Mistakes
Countries With the Highest Rates of Crypto Ownership
Mapped: The Number of AI Startups By Country
All of the Grants Given by the U.S. CHIPS Act
Mapped: The Income a Family Needs to Live Comfortably in Every U.S. State
Visualizing America’s Average Retirement Savings, by Age
Visualizing the Tax Burden of Every U.S. State
Charted: What Frustrates Americans About the Tax System
Mapped: Countries Where Recreational Cannabis is Legal
Which Countries Have the Highest Infant Mortality Rates?
Life Expectancy by Region (1950-2050F)
What Causes Preventable Child Deaths?
The Cost of an EpiPen in Major Markets
Ranked: The World’s Largest Lithium Producers in 2023
Who’s Building the Most Solar Energy?
Mapped: The Age of Energy Projects in Interconnection Queues, by State
Ranked: The Top 10 EV Battery Manufacturers in 2023
The World’s Biggest Nuclear Energy Producers
Mapped: The World’s Wettest and Driest Countries
Mapped: Indian States with Cities Over 1 Million People
Mapped: The Top Export in Each EU Country
The Biggest Salt Producing Countries in 2023
Visualizing Copper Production by Country in 2023
Where the World’s Aluminum is Smelted, by Country
Visualizing Global Gold Production in 2023
How People Get Around in America, Europe, and Asia
The Carbon Footprint of Major Travel Methods
Ranking the Top 15 Countries by Carbon Tax Revenue
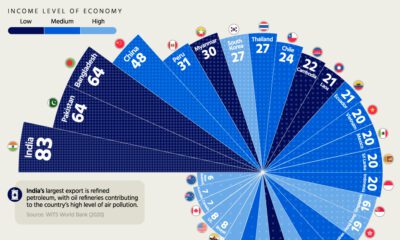
Ranked: The Countries With the Most Air Pollution in 2023
Top Countries By Forest Growth Since 2001
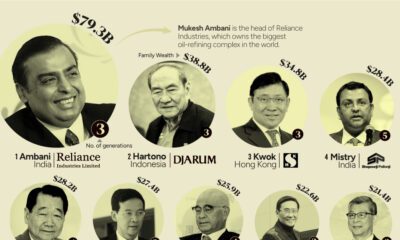
This graphic shows the 15 richest families in Asia. From energy to banking, these dynasties have built fortunes across many sectors.
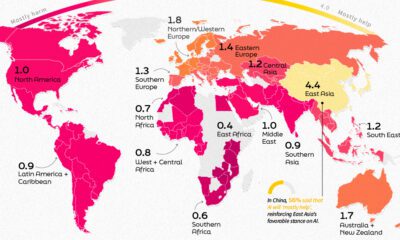
This infographic shows public perception of AI all over the globe and how this sentiment is affected by where you live.
The oil market is bigger than the 10 largest metal markets combined, with production value exceeding $2 trillion annually.
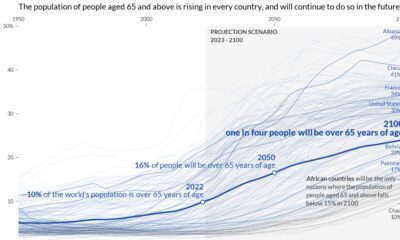
This graphic visualizes the world’s aging population, showing data for every country and territory around the world.
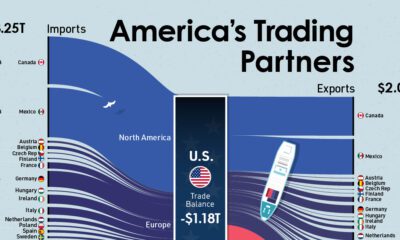
Who are the biggest trading partners of the U.S.? This visual showcases the trade balances between the U.S. and its trading partners.
Which economies have hazy air, and which ones enjoy mostly clear skies? Find out in this geographic breakdown of air pollution levels.
The U.S. labor market is remarkably strong, with a 3.4% unemployment rate. Which sectors are seeing the highest job gains in 2023?
Just four economies around the world had inflation below 2% in 2022. We show the countries with the lowest inflation globally.
See how 14 major automakers have adopted various fuel-saving technologies in this infographic based on EPA data.
How much oil, coal, and natural gas do we extract each year? See the scale of annual fossil fuel production in perspective.


 Creator Program