Mapped: The 10 U.S. States With the Lowest Real GDP Growth
Ranked: The World’s 50 Largest Private Equity Firms
Top 10 Countries Most in Debt to the IMF
Ranked: The Top 6 Economies by Share of Global GDP (1980-2024)
Mapped: Europe’s GDP Per Capita, by Country
Countries With the Highest Rates of Crypto Ownership
Mapped: The Number of AI Startups By Country
All of the Grants Given by the U.S. CHIPS Act
Visualizing AI Patents by Country
How Tech Logos Have Evolved Over Time
Visualizing America’s Average Retirement Savings, by Age
Visualizing the Tax Burden of Every U.S. State
Charted: What Frustrates Americans About the Tax System
Ranked: The Top 20 Countries in Debt to China
Mapped: Countries Where Recreational Cannabis is Legal
Which Countries Have the Highest Infant Mortality Rates?
Life Expectancy by Region (1950-2050F)
What Causes Preventable Child Deaths?
The Cost of an EpiPen in Major Markets
Who’s Building the Most Solar Energy?
Mapped: The Age of Energy Projects in Interconnection Queues, by State
Ranked: The Top 10 EV Battery Manufacturers in 2023
The World’s Biggest Nuclear Energy Producers
The World’s Biggest Oil Producers in 2023
Mapped: The Top Exports in Asian Countries
Mapped: U.S. States By Number of Cities Over 250,000 Residents
Mapped: U.S. Immigrants by Region
The Biggest Salt Producing Countries in 2023
Visualizing Copper Production by Country in 2023
Where the World’s Aluminum is Smelted, by Country
Visualizing Global Gold Production in 2023
How People Get Around in America, Europe, and Asia
The Carbon Footprint of Major Travel Methods
Ranking the Top 15 Countries by Carbon Tax Revenue
Ranked: The Countries With the Most Air Pollution in 2023
Top Countries By Forest Growth Since 2001
From cultural events that dominated headlines to geopolitical shifts and clashes, what major events defined 2023?
The distribution of wealth varies dramatically around the world. This graphic shows how it breaks down by wealth level in 2023.
This graphic showcases electricity emissions by state, highlighting each state's largest source of power.
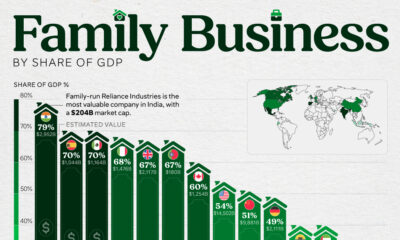
Family-owned businesses are key drivers of the global economy. This graphic shows their economic contribution to GDP, by country.
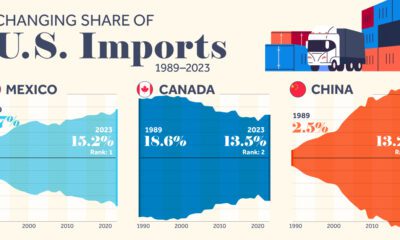
We highlight seven key U.S. trade partners and their changing share in the sources of U.S. imports from 1989–2023.
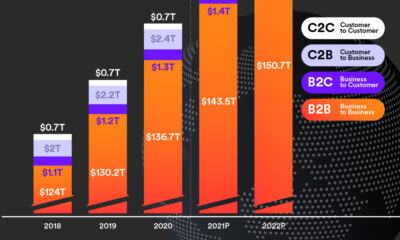
Cross-border payments grew to $150 trillion in 2022—nearly 30x the size of the global tech industry—and could hit $250 trillion by 2027.
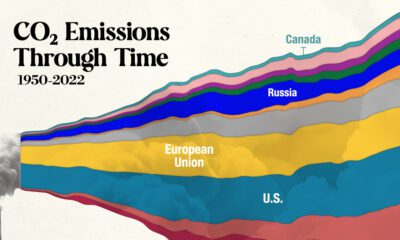
In this streamgraph, we break down global CO2 emissions between 1950 and 2022 using data from Berkeley Earth and Global Carbon Project.
Which economies are expected to see interest rates rise, or fall? We highlight IMF forecasts for international interest rates through 2028.
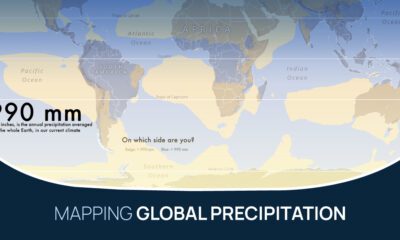
What does the global precipitation map look like if we split it in two, one half with below average rainfall and the other above?
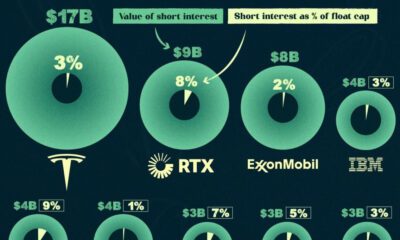
In this infographic, we list the 15 most shorted stocks in the U.S. in the Fall of 2023, ranked by the value of their short interest.


 Creator Program