Energy
The Future of Global Coal Production (2021-2024F)
![]() Subscribe to the Elements free mailing list for more like this
Subscribe to the Elements free mailing list for more like this
The Future of Global Coal Production Visualized
This was originally posted on Elements. Sign up to the free mailing list to get beautiful visualizations on natural resource megatrends in your email every week.
Coal is the world’s most affordable energy fuel, and as such, the world’s biggest commodity market for electricity generation.
Unfortunately, that low-cost energy comes at a high cost for the environment, with coal being the largest source of energy-related CO2 emissions.
Despite its large footprint, coal was in high demand in 2021. As economies reopened following the start of the COVID-19 pandemic, countries struggled to meet resurgent energy needs. As a readily available low-cost energy source, coal filled the supply gap, with global coal consumption increasing by 450 million tonnes or around +6% in 2021.
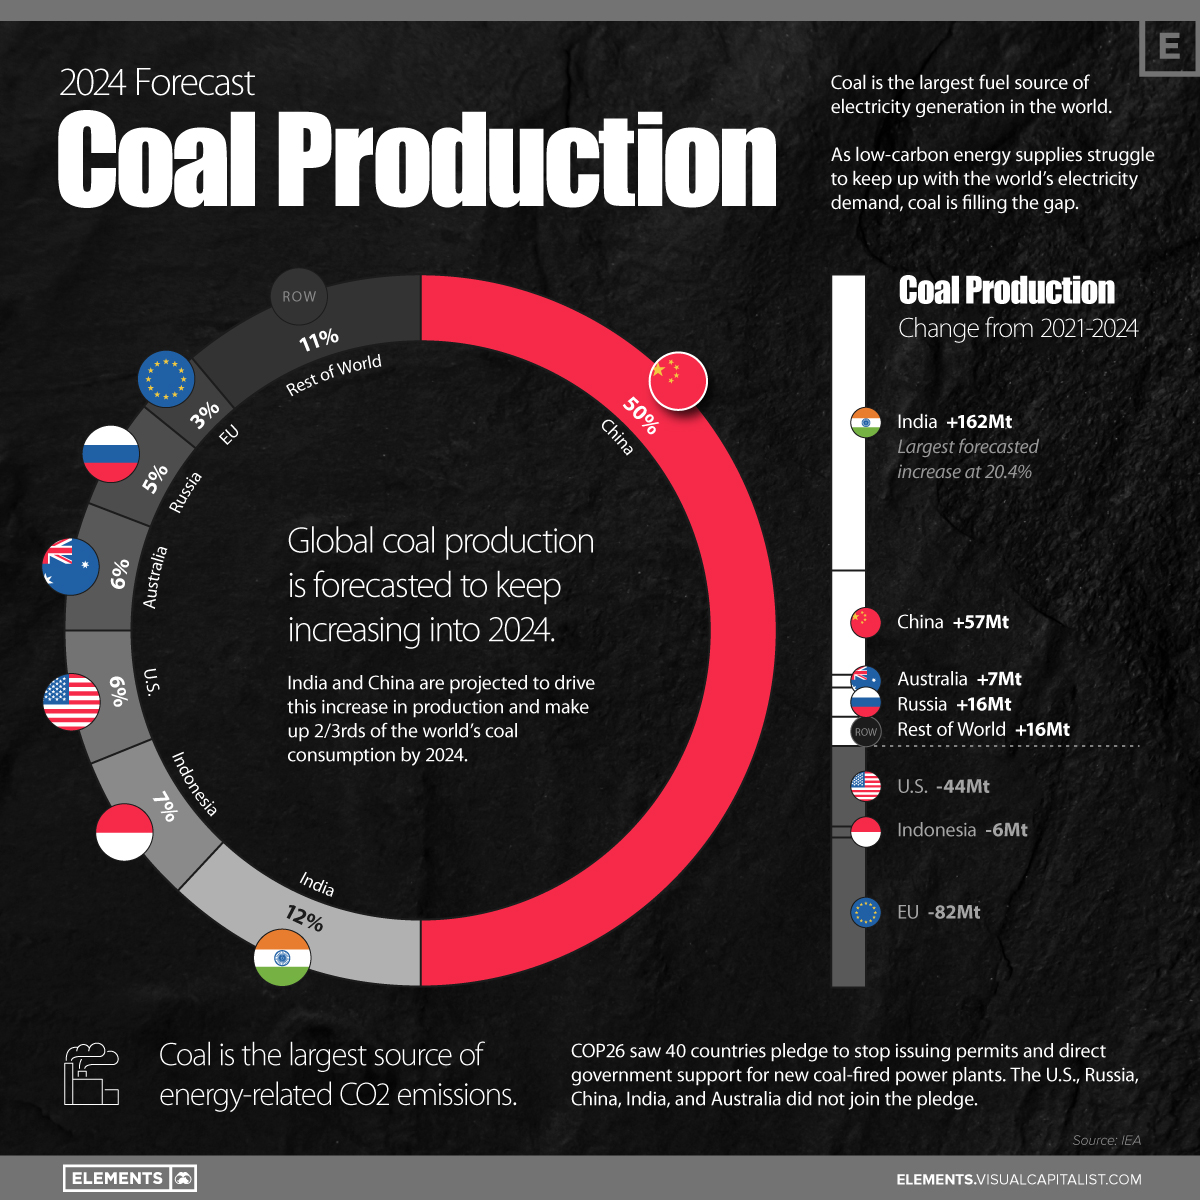
This graphic looks at the IEA’s coal production forecasts for 2024, and the specific countries projected to reduce or increase their production over the next few years.
Which Countries Are Increasing (or Reducing) Coal Production?
Global coal production was a topic of scrutiny at the COP26 conference held in November of 2021, where 40 countries pledged to stop issuing permits and direct government support for new coal-fired power plants.
However, many of the top coal-producing countries did not commit to the pledge. China, the U.S., India, Russia, and Australia abstained, and of those five, only the U.S. is forecasted to reduce coal production in the next two years.
| Country | Coal Production (2021) | Coal Production (2024F) | Share (2024F) | Change (2021–2024F) |
|---|---|---|---|---|
| 🇨🇳 China | 3,925 Mt | 3,982 Mt | 50% | +57 Mt |
| 🇮🇳 India | 793 Mt | 955 Mt | 12% | +162 Mt |
| 🇮🇩 Indonesia | 576 Mt | 570 Mt | 7% | -6 Mt |
| 🇺🇸 United States | 528 Mt | 484 Mt | 6% | -44 Mt |
| 🇦🇺 Australia | 470 Mt | 477 Mt | 6% | +7 Mt |
| 🇷🇺 Russia | 429 Mt | 445 Mt | 5% | +16 Mt |
| 🇪🇺 European Union | 329 Mt | 247 Mt | 3% | -82 Mt |
| 🌐 Other | 839 Mt | 855 Mt | 11% | +16 Mt |
Source: IEA
With 15 EU countries signing the pledge, the European Union is forecasted to see the greatest drop in coal production at 82 million tonnes, along with the greatest forecasted reduction in coal consumption (101 million tonnes, a 23% reduction).
Reducing Coal-Fired Power Generation in the U.S.
The U.S. and Indonesia are the other two major producers forecasted to reduce their reliance on coal. The U.S. is projected to cut coal production by 7.5% or 44 million tonnes, while Indonesia’s reduction is forecasted at 6 million tonnes, or just a 1% cut of its 2021 production.
Despite not joining the COP26 pledge, the U.S. is still noticeably pursuing short and long-term initiatives to reduce coal-fired power generation.
In fact, 85% of U.S. electric generating capacity retirements in 2022 are forecast to be coal-fired generators, and there are further plans to retire 28% (59 GW) of currently operational coal-fired capacity by 2035.
Coal Makes Energy Ends Meet in China and India
Modern consumption and production are instead focused in Asia.
China and India produce almost 60% of the world’s coal, and are expected to increase their production by more than 200 million tonnes per year, collectively. All this coal goes towards meeting the insatiable energy demands of both nations.
While China has pledged to start cutting down coal consumption in 2026, the country also announced the construction of 43 new coal-fired power plants to meet energy demand until then. Part of the additional production is driven by a need to reduce the country’s dependence on coal imports, which are expected to drop by 51 million tonnes or 16% from 2021–2024.
By 2024, China’s coal consumption is forecasted to rise by 3.3% and India’s by 12.2%, which would make the two countries responsible for two-thirds of the world’s coal consumption.


Who’s Building the Most Solar Energy?
This was originally posted on our Voronoi app. Download the app for free on iOS or Android and discover incredible data-driven charts from a variety of trusted sources.
In 2023, solar energy accounted for three-quarters of renewable capacity additions worldwide. Most of this growth occurred in Asia, the EU, and the U.S., continuing a trend observed over the past decade.
In this graphic, we illustrate the rise in installed solar photovoltaic (PV) capacity in China, the EU, and the U.S. between 2010 and 2022, measured in gigawatts (GW). Bruegel compiled the data..
Chinese Dominance
As of 2022, China’s total installed capacity stands at 393 GW, nearly double that of the EU’s 205 GW and surpassing the USA’s total of 113 GW by more than threefold in absolute terms.
| Installed solar capacity (GW) | China | EU27 | U.S. |
|---|---|---|---|
| 2022 | 393.0 | 205.5 | 113.0 |
| 2021 | 307.0 | 162.7 | 95.4 |
| 2020 | 254.0 | 136.9 | 76.4 |
| 2019 | 205.0 | 120.1 | 61.6 |
| 2018 | 175.3 | 104.0 | 52.0 |
| 2017 | 130.8 | 96.2 | 43.8 |
| 2016 | 77.8 | 91.5 | 35.4 |
| 2015 | 43.6 | 87.7 | 24.2 |
| 2014 | 28.4 | 83.6 | 18.1 |
| 2013 | 17.8 | 79.7 | 13.3 |
| 2012 | 6.7 | 71.1 | 8.6 |
| 2011 | 3.1 | 53.3 | 5.6 |
| 2010 | 1.0 | 30.6 | 3.4 |
Since 2017, China has shown a compound annual growth rate (CAGR) of approximately 25% in installed PV capacity, while the USA has seen a CAGR of 21%, and the EU of 16%.
Additionally, China dominates the production of solar power components, currently controlling around 80% of the world’s solar panel supply chain.
In 2022, China’s solar industry employed 2.76 million individuals, with manufacturing roles representing approximately 1.8 million and the remaining 918,000 jobs in construction, installation, and operations and maintenance.
The EU industry employed 648,000 individuals, while the U.S. reached 264,000 jobs.
According to the IEA, China accounts for almost 60% of new renewable capacity expected to become operational globally by 2028.
Despite the phasing out of national subsidies in 2020 and 2021, deployment of solar PV in China is accelerating. The country is expected to reach its national 2030 target for wind and solar PV installations in 2024, six years ahead of schedule.

-

 United States6 days ago
Mapped: Countries Where Recreational Cannabis is Legal
-

 Healthcare2 weeks ago
Life Expectancy by Region (1950-2050F)
-

 Markets2 weeks ago
The Growth of a $1,000 Equity Investment, by Stock Market
-

 Markets2 weeks ago
Mapped: Europe’s GDP Per Capita, by Country
-

 Money2 weeks ago
Charted: What Frustrates Americans About the Tax System
-

 Technology2 weeks ago
Countries With the Highest Rates of Crypto Ownership
-

 Mining2 weeks ago
Where the World’s Aluminum is Smelted, by Country
-

 Personal Finance1 week ago
Visualizing the Tax Burden of Every U.S. State