Energy
Craft Oil: The Lesser Known Side of America’s Energy Industry
Craft Oil: The Lesser Known Side of America’s Energy Industry
Go back a decade, and America’s energy industry was quite the hot button issue.
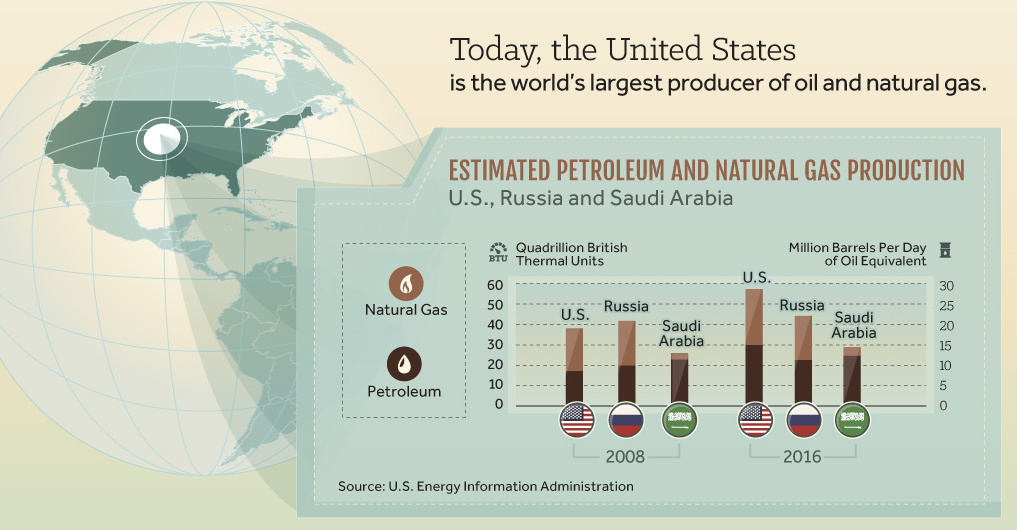
Oil prices were soaring past $100/bbl, the country was still reliant on OPEC for imports, and a lack of energy independence was becoming a costly issue. Meanwhile, the United States was being outclassed on the energy production front by both Saudi Arabia and Russia.
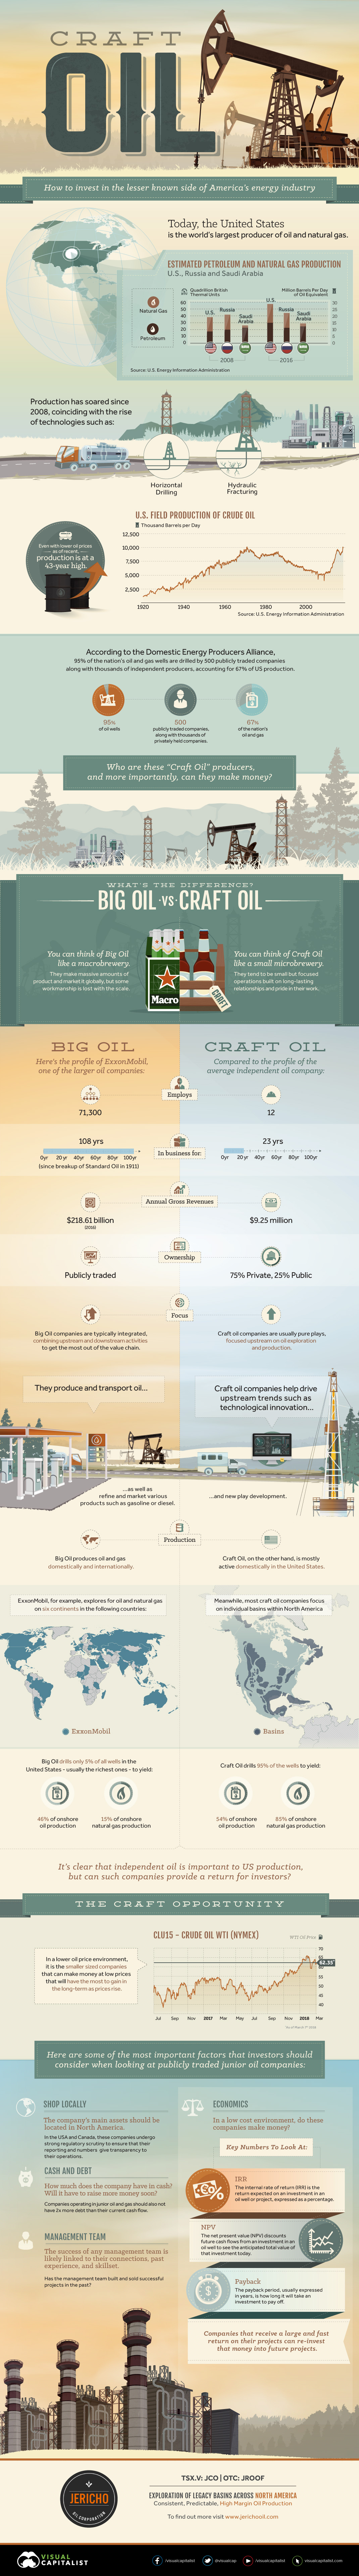
However, in the short span of eight years – and thanks to the use of technologies like horizontal drilling and hydraulic fracturing – the United States quickly went from having a questionable energy future to being in a clear position of strength. Today, even with lower prices, U.S. field production of crude is at a 43-year high.
America’s Independent Oil Producers
Since 2016, the U.S. has produced close to the equivalent of 30 million bpd in oil and natural gas, making the United States a champion of global energy production.
Today’s infographic from Jericho Oil focuses on a key part of the turnaround in the U.S. energy sector that often gets overshadowed by Big Oil players like ExxonMobil or Royal Dutch Shell. It covers the role of “Craft Oil” in the industry, an umbrella that includes many small, independent, and focused companies across America that produce oil and gas on a domestic basis.
The thousands of companies in this group, many which are community-driven or family-owned, actually drill 95% of the country’s oil wells to yield 54% of onshore oil and 85% of onshore gas production.
Comparing Big Oil to Craft Oil
Below is a comparison of ExxonMobil to the profile of an average Craft Oil company:
| Employees | ||
| Years in Business | ||
| Annual Gross Revenues | ||
| Ownership | ||
| Level of Integration | ||
| Focus | ||
| Production |
Most Craft Oil companies are very small in comparison – but together, they contribute to a very significant portion of U.S. production, as well as the economy.
Investing in Craft Oil
Do these independent producers provide a strategic opportunity for investors?
Yes, but here are a few areas investors should consider evaluating before taking any action:
Location of Assets:
In the U.S. and Canada, independent oil companies undergo strong regulatory scrutiny to make sure their reporting and numbers give transparency to their operations.
Cash and Debt:
How much does the company have in cash? Will they have to raise more money soon?
Companies operating in junior oil and gas should not have more than 2x more debt than their current cash flow.
Management Team:
The strength of any management team is linked to their connections, past experience, and skill set. If the management team has built and sold successful projects in the past, that is a good sign of strength.
Economics:
Investors need to be aware of key metrics to gauge if junior oil and gas companies can make money in the current or projected cost environment. These include IRR (Internal Rate of Return), NPV (Net present value), and payback period. Companies that make their money back fast and with a good return can re-invest that capital into additional projects.


Who’s Building the Most Solar Energy?
This was originally posted on our Voronoi app. Download the app for free on iOS or Android and discover incredible data-driven charts from a variety of trusted sources.
In 2023, solar energy accounted for three-quarters of renewable capacity additions worldwide. Most of this growth occurred in Asia, the EU, and the U.S., continuing a trend observed over the past decade.
In this graphic, we illustrate the rise in installed solar photovoltaic (PV) capacity in China, the EU, and the U.S. between 2010 and 2022, measured in gigawatts (GW). Bruegel compiled the data..
Chinese Dominance
As of 2022, China’s total installed capacity stands at 393 GW, nearly double that of the EU’s 205 GW and surpassing the USA’s total of 113 GW by more than threefold in absolute terms.
| Installed solar capacity (GW) | China | EU27 | U.S. |
|---|---|---|---|
| 2022 | 393.0 | 205.5 | 113.0 |
| 2021 | 307.0 | 162.7 | 95.4 |
| 2020 | 254.0 | 136.9 | 76.4 |
| 2019 | 205.0 | 120.1 | 61.6 |
| 2018 | 175.3 | 104.0 | 52.0 |
| 2017 | 130.8 | 96.2 | 43.8 |
| 2016 | 77.8 | 91.5 | 35.4 |
| 2015 | 43.6 | 87.7 | 24.2 |
| 2014 | 28.4 | 83.6 | 18.1 |
| 2013 | 17.8 | 79.7 | 13.3 |
| 2012 | 6.7 | 71.1 | 8.6 |
| 2011 | 3.1 | 53.3 | 5.6 |
| 2010 | 1.0 | 30.6 | 3.4 |
Since 2017, China has shown a compound annual growth rate (CAGR) of approximately 25% in installed PV capacity, while the USA has seen a CAGR of 21%, and the EU of 16%.
Additionally, China dominates the production of solar power components, currently controlling around 80% of the world’s solar panel supply chain.
In 2022, China’s solar industry employed 2.76 million individuals, with manufacturing roles representing approximately 1.8 million and the remaining 918,000 jobs in construction, installation, and operations and maintenance.
The EU industry employed 648,000 individuals, while the U.S. reached 264,000 jobs.
According to the IEA, China accounts for almost 60% of new renewable capacity expected to become operational globally by 2028.
Despite the phasing out of national subsidies in 2020 and 2021, deployment of solar PV in China is accelerating. The country is expected to reach its national 2030 target for wind and solar PV installations in 2024, six years ahead of schedule.

-

 Technology1 week ago
Countries With the Highest Rates of Crypto Ownership
-

 Mining6 days ago
Visualizing Copper Production by Country in 2023
-

 Politics7 days ago
Charted: How Americans Feel About Federal Government Agencies
-

 Healthcare1 week ago
Which Countries Have the Highest Infant Mortality Rates?
-

 Demographics1 week ago
Mapped: U.S. Immigrants by Region
-

 Maps1 week ago
Mapped: Southeast Asia’s GDP Per Capita, by Country
-

 Automotive1 week ago
How People Get Around in America, Europe, and Asia
-

 Personal Finance1 week ago
Visualizing the Tax Burden of Every U.S. State