Maps
Visualized: Which Coastal Cities are Sinking the Fastest?
Article/Editing:
![]() See this visualization first on the Voronoi app.
See this visualization first on the Voronoi app.
Which Coastal Cities Are Sinking the Fastest?
This was originally posted on our Voronoi app. Download the app for free on iOS or Android and discover incredible data-driven charts from a variety of trusted sources.
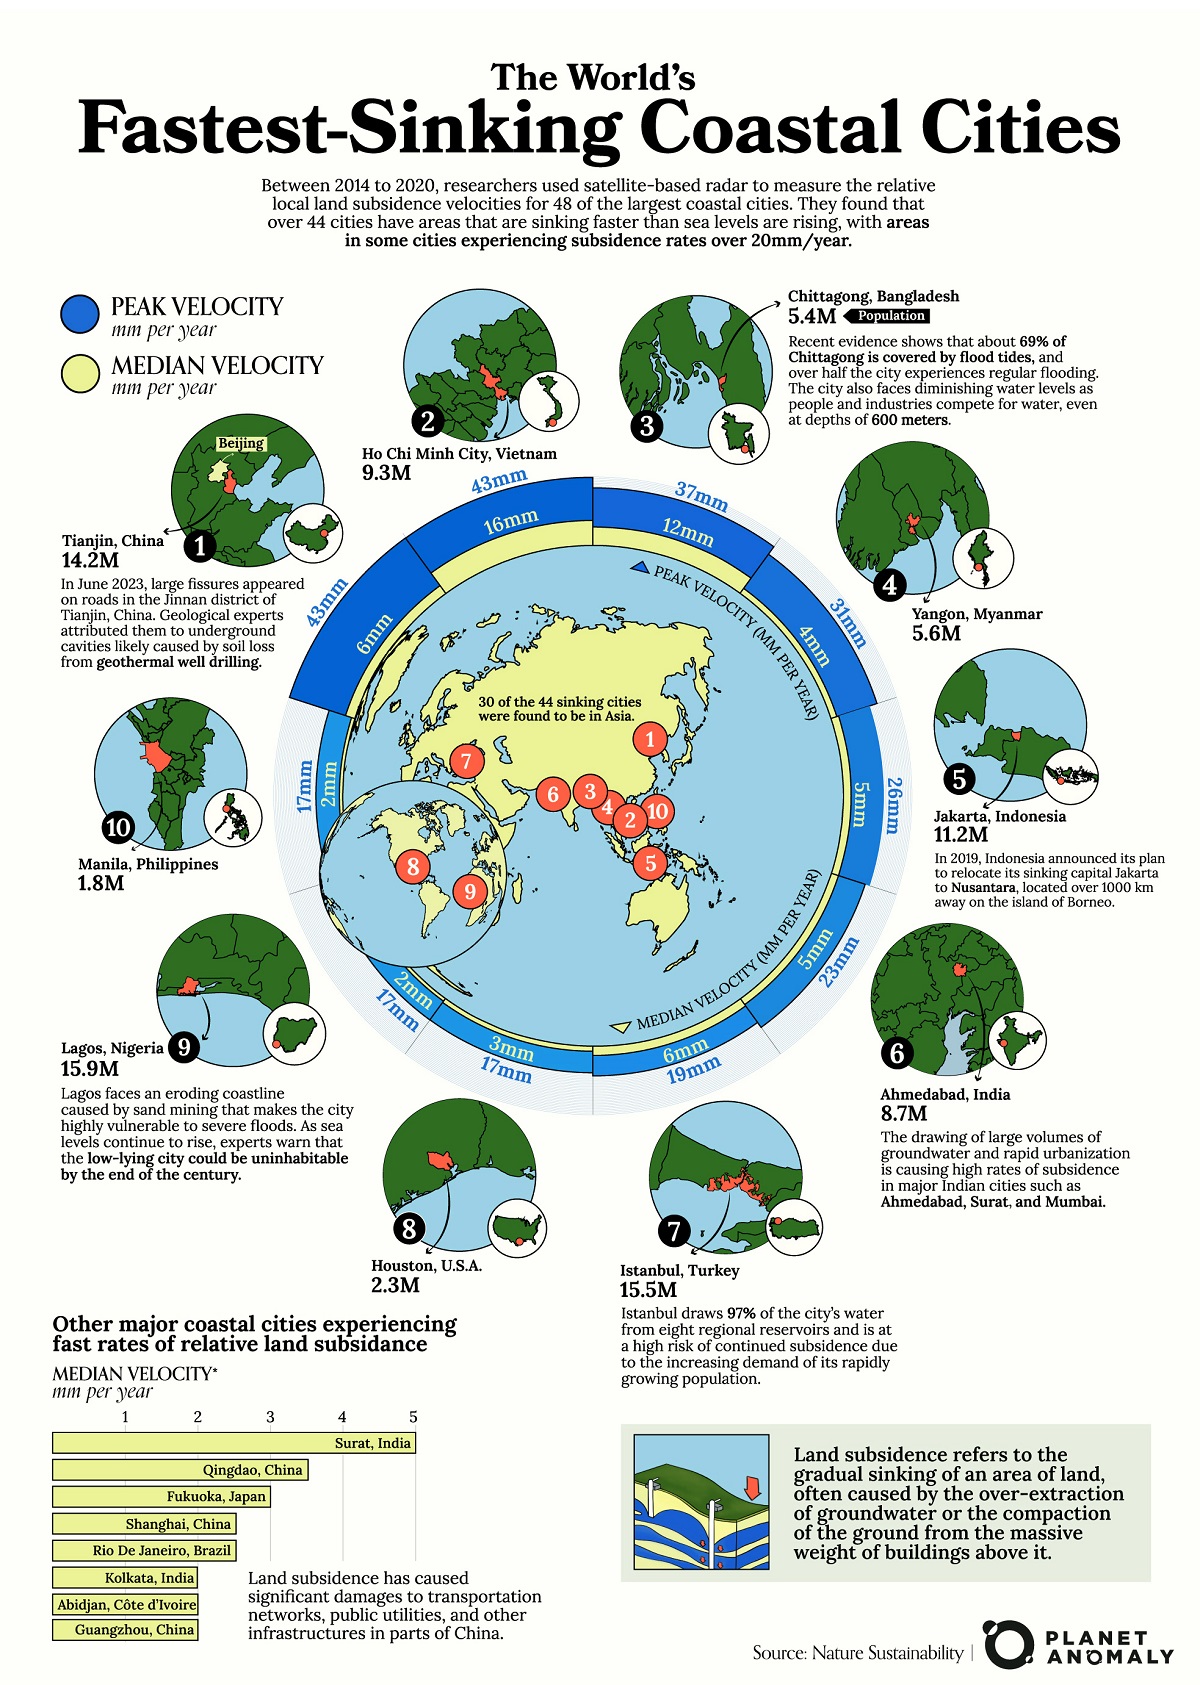
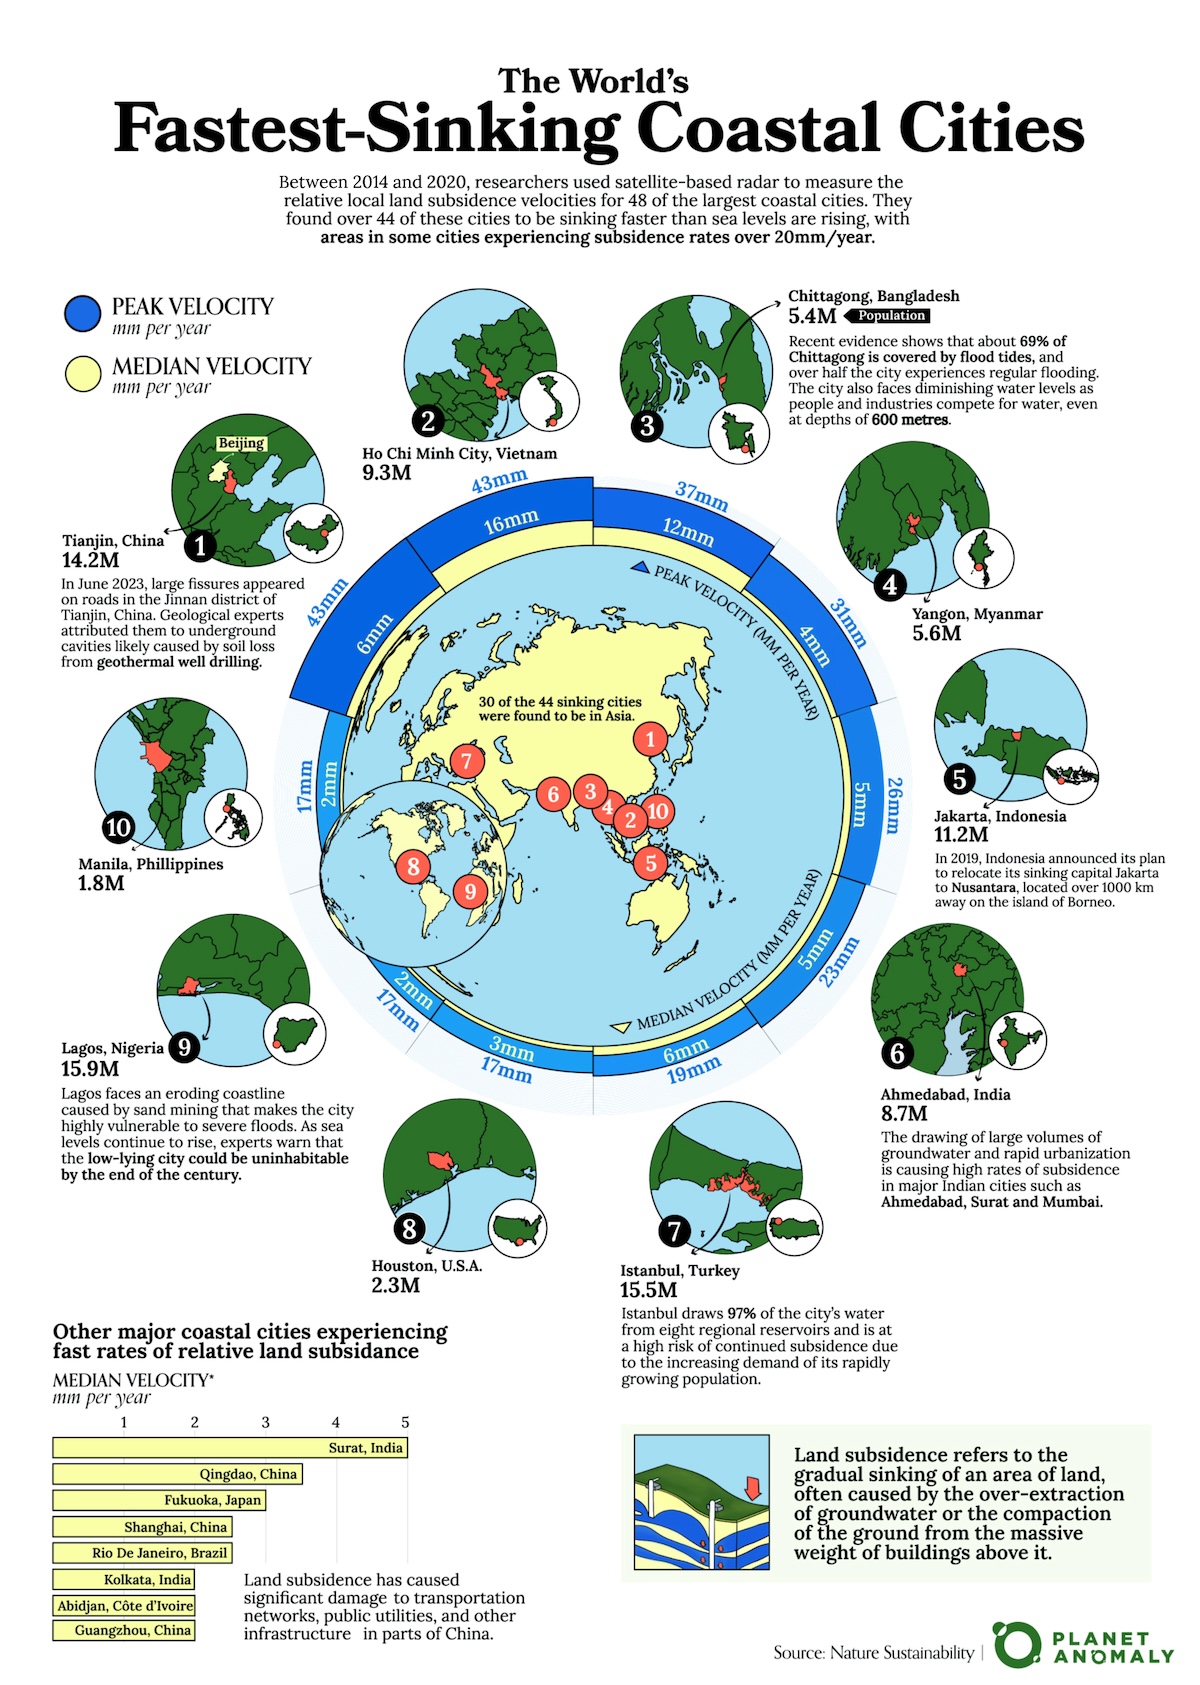
With sea levels rising, there is cause for concern about the livability of major coastal cities—often huge centers of trade and commerce, and homes to millions of people.
But an overlooked area is how coastal cities are themselves sinking—a phenomenon called relative local land subsidence (RLLS)—which occurs when underground materials, such as soil, rock, or even man-made structures, compact or collapse, causing the surface above to sink.
This can exacerbate the effects of rising sea levels (currently averaged at 3.7 mm/year), and is a useful metric to track for coastal communities.
Creator Planet Anomaly, looks at the top 10 cities ranked by the peak subsidence velocity. This graphic is based on a paper published by Nature Sustainability, which used satellite data to track land subsidence changes in 48 high-population coastal cities located within 50 kilometers of the coastline. Their data collection spanned six years from 2014 to 2020.
In that time period, they found that 44 of the cities they studied—many of them massively populated, developed megacities, built on flat, low-lying river deltas—had areas sinking faster than sea levels were rising.
The 10 Fastest Sinking Coastal Cities
One of the top cities on the list is Tianjin, China with a population of more than 14 million people, which has areas of the city experiencing peak RLLS velocities of 43 mm a year between 2014–2020. The median velocity is much lower, at 6 mm/year, which means some areas are sinking much faster than the overall metropolitan area.
Tianjin is bordered by Beijing municipality to the northwest and the Bohai Gulf to the east. In June 2023, large cracks appeared on Tianjin’s streets, caused by underground land collapses, a byproduct of extensive geothermal drilling, according to the local government.
| Rank | City | Country | Peak Velocity (mm/year) | Median Velocity (mm/year) |
|---|---|---|---|---|
| 1 | Tianjin | 🇨🇳 China | 43 | 6 |
| 2 | Ho Chi Minh City | 🇻🇳 Vietnam | 43 | 16 |
| 3 | Chittagong | 🇧🇩 Bangladesh | 37 | 12 |
| 4 | Yangon | 🇲🇲 Myanmar | 31 | 4 |
| 5 | Jakarta | 🇮🇩 Indonesia | 26 | 5 |
| 6 | Ahmedabad | 🇮🇳 India | 23 | 5 |
| 7 | Istanbul | 🇹🇷 Turkey | 19 | 6 |
| 8 | Houston | 🇺🇸 U.S. | 17 | 3 |
| 9 | Lagos | 🇳🇬 Nigeria | 17 | 2 |
| 10 | Manila | 🇵🇭 Philippines | 17 | 2 |
Ho Chi Minh City (population 9 million) in Vietnam also faces similar RLLS rates as Tianjin though its median velocity is much higher at 16 mm/year.
Chittagong, Bangladesh, Yangon, Myanmar, and Jakarta, Indonesia, round out the top five fastest sinking coastal cities by relative land subsidence. They all face a similar web of contributing factors as the authors of the paper note below:
“Many of these fast-subsiding coastal cities are rapidly expanding megacities, where anthropogenic factors, such as high demands for groundwater extraction and loading from densely constructed building structures, contribute to local land subsidence.” — Tay, C., Lindsey, E.O., Chin, S.T. et al.
In fact, Indonesia has ambitious plans to relocate its sinking capital, Jakarta, to another island, a move that could cost the Indonesian government more than $120 billion. This comes after the forecast that one-third of Jakarta could be submerged as early as 2050. Aside from the regular flooding, Jakarta is also extremely prone to earthquakes.
Why Measure Local Land Subsidence?
The researchers of this report argue that local land subsidence is largely underestimated in relative sea level rise assessments and is crucial for the sustainable development of coastal areas.
The data they’ve collected—peak velocity versus median velocity—also allows them to identify specific areas and neighborhoods in cities that are undergoing rapid subsidence and thus facing a greater exposure to coastal hazards.
In New York, for example, their results suggested that subsidence is only localized west of Breezy Point and “should not be extrapolated eastward along the coast” of Long Island.

This article was published as a part of Visual Capitalist's Creator Program, which features data-driven visuals from some of our favorite Creators around the world.


Maps
Mapped: The 10 U.S. States With the Lowest Real GDP Growth
In this graphic, we show where real GDP lagged the most across America in 2023 as high interest rates weighed on state economies.


The Top 10 U.S. States, by Lowest Real GDP Growth
This was originally posted on our Voronoi app. Download the app for free on iOS or Android and discover incredible data-driven charts from a variety of trusted sources.
While the U.S. economy defied expectations in 2023, posting 2.5% in real GDP growth, several states lagged behind.
Last year, oil-producing states led the pack in terms of real GDP growth across America, while the lowest growth was seen in states that were more sensitive to the impact of high interest rates, particularly due to slowdowns in the manufacturing and finance sectors.
This graphic shows the 10 states with the least robust real GDP growth in 2023, based on data from the Bureau of Economic Analysis.
Weakest State Economies in 2023
Below, we show the states with the slowest economic activity in inflation-adjusted terms, using chained 2017 dollars:
| Rank | State | Real GDP Growth 2023 YoY | Real GDP 2023 |
|---|---|---|---|
| 1 | Delaware | -1.2% | $74B |
| 2 | Wisconsin | +0.2% | $337B |
| 3 | New York | +0.7% | $1.8T |
| 4 | Missississippi | +0.7% | $115B |
| 5 | Georgia | +0.8% | $661B |
| 6 | Minnesota | +1.2% | $384B |
| 7 | New Hampshire | +1.2% | $91B |
| 8 | Ohio | +1.2% | $698B |
| 9 | Iowa | +1.3% | $200B |
| 10 | Illinois | +1.3% | $876B |
| U.S. | +2.5% | $22.4T |
Delaware witnessed the slowest growth in the country, with real GDP growth of -1.2% over the year as a sluggish finance and insurance sector dampened the state’s economy.
Like Delaware, the Midwestern state of Wisconsin also experienced declines across the finance and insurance sector, in addition to steep drops in the agriculture and manufacturing industries.
America’s third-biggest economy, New York, grew just 0.7% in 2023, falling far below the U.S. average. High interest rates took a toll on key sectors, with notable slowdowns in the construction and manufacturing sectors. In addition, falling home prices and a weaker job market contributed to slower economic growth.
Meanwhile, Georgia experienced the fifth-lowest real GDP growth rate. In March 2024, Rivian paused plans to build a $5 billion EV factory in Georgia, which was set to be one of the biggest economic development initiatives in the state in history.
These delays are likely to exacerbate setbacks for the state, however, both Kia and Hyundai have made significant investments in the EV industry, which could help boost Georgia’s manufacturing sector looking ahead.

-

 Personal Finance1 week ago
Visualizing the Tax Burden of Every U.S. State
-

 Misc7 days ago
Visualized: Aircraft Carriers by Country
-

 Culture1 week ago
How Popular Snack Brand Logos Have Changed
-

 Mining1 week ago
Visualizing Copper Production by Country in 2023
-

 Misc1 week ago
Charted: How Americans Feel About Federal Government Agencies
-

 Healthcare1 week ago
Which Countries Have the Highest Infant Mortality Rates?
-

 Demographics1 week ago
Mapped: U.S. Immigrants by Region
-

 Maps1 week ago
Mapped: Southeast Asia’s GDP Per Capita, by Country