Economy
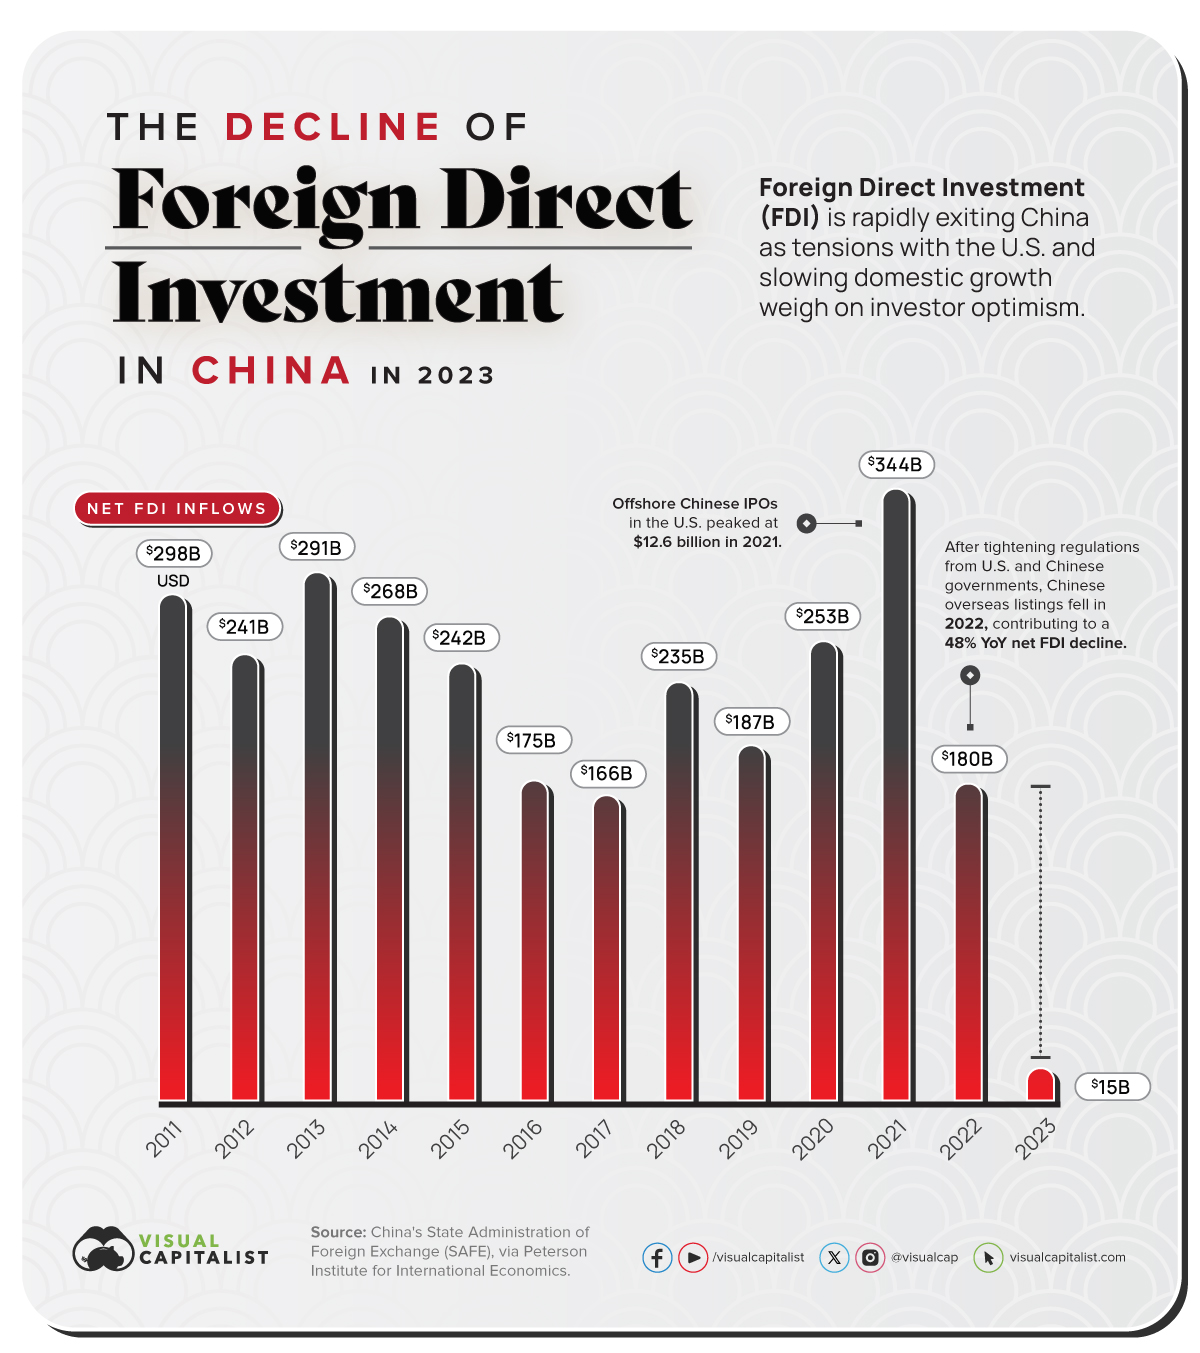
Charted: Chinese FDI Inflows Hit Multi-Year Lows
![]() See this visualization first on the Voronoi app.
See this visualization first on the Voronoi app.
Charted: Chinese FDI Inflows Hit Multi-Year Lows
This was originally posted on our Voronoi app. Download the app for free on iOS or Android and discover incredible data-driven charts from a variety of trusted sources.
The Chinese economy has thrown up several red flags in 2023 and now foreign investors are losing confidence in the world’s second-largest economy.
Data accessed via the Peterson Institute for International Economics and sourced from China’s State Administration of Foreign Exchange (SAFE) shows foreign direct investment (FDI) inflows have hit multi-year lows.
Foreign Investors Hit “Sell” on China in 2023
Aside from a broadly slowing economy, the Peterson Institute’s analysis highlights other key reasons why FDI inflows have scaled back so dramatically this year.
Firstly, geopolitical tensions (in the form of an escalating chip war) between the U.S. and China are worrying foreign investors—many of them American-headquartered companies with a presence in China, holding back on investments in local companies.
Secondly, the closure of due diligence firms (which allow foreign investors to make informed decisions on Chinese companies) along with a new national security law aimed at restricting cross-border data flows have disincentivized foreign investors from betting big if they wanted to.
| Year | FDI Inflows | YoY Change |
|---|---|---|
| 2011 | $280B | N/A |
| 2012 | $241B | -13.93% |
| 2013 | $291B | +20.75% |
| 2014 | $268B | -7.90% |
| 2015 | $242B | -9.70% |
| 2016 | $175B | -27.69% |
| 2017 | $166B | -5.14% |
| 2018 | $235B | +41.57% |
| 2019 | $187B | -20.43% |
| 2020 | $253B | +35.29% |
| 2021 | $344B | +35.97% |
| 2022 | $180B | -47.67% |
| 2023 Q1-Q3 | $15B | -91.67% |
Meanwhile, huge spikes in FDI inflows between 2018 and 2021 indicate the success of Chinese companies listing on American securities exchanges, which SAFE includes in its data. However, crackdowns from both Chinese and U.S. securities regulators in 2022 turned the tap off briefly. Despite the restrictions being since removed, new listings have not bounced back.
Another Red Flag for the Chinese Economy
The Peterson Institute’s comparison of gross and net FDI flows found a nearly $100 billion shortfall—which means foreign firms are selling their Chinese investments, adding yet another red flag for the economy.
This slowdown is now having a ripple effect across the region—for Japan, South Korea, and Thailand’s economies—whose export sectors rely on substantial Chinese demand. Nations in sub-saharan Africa will also feel the pinch as Chinese sovereign lending continues to fall, already past the lowest it’s been in two decades.
Meanwhile, on a broader scale, Chinese growth contributes to one-third of world economic growth, which means the global economy will miss growth projections made last year—when economists had a more optimistic view of the world’s second-largest economy.


Misc
The Top 25 Nationalities of U.S. Immigrants
Mexico is the largest source of immigrants to the U.S., with almost 11 million immigrants.


The Top 25 Nationalities of U.S. Immigrants
This was originally posted on our Voronoi app. Download the app for free on iOS or Android and discover incredible data-driven charts from a variety of trusted sources.
The United States is home to more than 46 million immigrants, constituting approximately 14% of its total population.
This graphic displays the top 25 countries of origin for U.S. immigrants, based on 2022 estimates. The data is sourced from the Migration Policy Institute (MPI), which analyzed information from the U.S. Census Bureau’s 2022 American Community Survey.
In this context, “immigrants” refer to individuals residing in the United States who were not U.S. citizens at birth.
Mexico Emerges as a Leading Source of Immigration
Mexico stands out as the largest contributor to U.S. immigration due to its geographical proximity and historical ties.
Various economic factors, including wage disparities and employment opportunities, motivate many Mexicans to seek better prospects north of the border.
| Country | Region | # of Immigrants |
|---|---|---|
| 🇲🇽 Mexico | Latin America & Caribbean | 10,678,502 |
| 🇮🇳 India | Asia | 2,839,618 |
| 🇨🇳 China | Asia | 2,217,894 |
| 🇵🇭 Philippines | Asia | 1,982,333 |
| 🇸🇻 El Salvador | Latin America & Caribbean | 1,407,622 |
| 🇻🇳 Vietnam | Asia | 1,331,192 |
| 🇨🇺 Cuba | Latin America & Caribbean | 1,312,510 |
| 🇩🇴 Dominican Republic | Latin America & Caribbean | 1,279,900 |
| 🇬🇹 Guatemala | Latin America & Caribbean | 1,148,543 |
| 🇰🇷 Korea | Asia | 1,045,100 |
| 🇨🇴 Colombia | Latin America & Caribbean | 928,053 |
| 🇭🇳 Honduras | Latin America & Caribbean | 843,774 |
| 🇨🇦 Canada | Northern America | 821,322 |
| 🇯🇲 Jamaica | Latin America & Caribbean | 804,775 |
| 🇭🇹 Haiti | Latin America & Caribbean | 730,780 |
| 🇬🇧 United Kingdom | Europe | 676,652 |
| 🇻🇪 Venezuela | Latin America & Caribbean | 667,664 |
| 🇧🇷 Brazil | Latin America & Caribbean | 618,525 |
| 🇩🇪 Germany | Europe | 537,484 |
| 🇪🇨 Ecuador | Latin America & Caribbean | 518,287 |
| 🇵🇪 Peru | Latin America & Caribbean | 471,988 |
| 🇳🇬 Nigeria | Africa | 448,405 |
| 🇺🇦 Ukraine | Europe | 427,163 |
| 🇮🇷 Iran | Middle East | 407,283 |
| 🇵🇰 Pakistan | Asia | 399,086 |
| Rest of World | 11,637,634 | |
| Total | 46,182,089 |
Mexicans are followed in this ranking by Indians, Chinese, and Filipinos, though most immigrants on this list come from countries in the Latin American and Caribbean region.
On the other hand, only three European countries are among the top sources of U.S. immigrants: the UK, Germany, and Ukraine.
Immigration continues to be a significant factor contributing to the overall growth of the U.S. population. Overall population growth has decelerated over the past decade primarily due to declining birth rates.
Between 2021 and 2022, the increase in the immigrant population accounted for 65% of the total population growth in the U.S., representing 912,000 individuals out of nearly 1.4 million.
If you enjoyed this post, be sure to check out Visualized: Why Do People Immigrate to the U.S.? This visualization shows the different reasons cited by new arrivals to America in 2021.

-

 United States1 week ago
Mapped: Countries Where Recreational Cannabis is Legal
-

 Healthcare2 weeks ago
Life Expectancy by Region (1950-2050F)
-

 Markets2 weeks ago
The Growth of a $1,000 Equity Investment, by Stock Market
-

 Markets2 weeks ago
Mapped: Europe’s GDP Per Capita, by Country
-

 Money2 weeks ago
Charted: What Frustrates Americans About the Tax System
-

 Technology2 weeks ago
Countries With the Highest Rates of Crypto Ownership
-

 Mining2 weeks ago
Where the World’s Aluminum is Smelted, by Country
-

 Personal Finance2 weeks ago
Visualizing the Tax Burden of Every U.S. State