Energy
Lithium: The Fuel of the Green Revolution

Lithium: The Fuel of the Green Revolution
The world is shifting greener.
And while people have always wanted electric cars and inexpensive solar power, the reality is that until recently, battery technology just wasn’t good enough to store energy on an economical or practical basis.
Things have changed, and the green revolution has been kickstarted by battery power. The commercialization of the lithium-ion battery has solved a crucial green energy problem for two major reasons that can be related back to the properties of lithium:
1) Lithium has extremely high electrochemical potential, and so do lithium-ion cells:
| Battery cell | Typical Voltage |
|---|---|
| Lithium-ion (Cobalt) | 3.6V |
| Lead Acid | 2.0V |
| NiMH | 1.2V |
| NiCd | 1.2V |
This means one lithium-ion cell can do more – making it much more efficient to use in everything from electronics to energy storage.
2) Lithium is also the lightest metal on the periodic table. Batteries need to be as light as possible, especially in electric cars.
How Lithium Gets Used
2001
Many years ago, lithium was used chiefly for a variety of industrial purposes. Major sources of lithium demand included ceramics, glass, aluminum production, lubricants, and as a catalyst for rubber production.
2015
In modern times, with the commercialization of the lithium-ion, batteries are now the major source of demand for lithium at 39%.
2025
According to a report by Deutsche Bank, in 2025 the battery market for lithium alone will be more than 2x bigger than the total lithium market today.
About 70% of all lithium will go to electric vehicles, e-bikes, traditional batteries, and energy storage, making it the uncontested fuel of the green revolution.
Major Lithium Drivers
Lithium-ion battery demand is primarily driven by rapid growth in the electric vehicle market, which is expected to make up 35% of all vehicle demand by 2040.
But renewable energy storage also plays a role in driving lithium demand. With solar and wind energy being installed at a rapid pace, that means more batteries must be procured to store this energy. This can be done for a home system with a product like Tesla’s Powerwall 2.0, and it is being done on a utility scale as well.
Two Types of Lithium
Prices for lithium have skyrocketed in the last two years – and it is worth knowing the two different types of lithium used by the market.
Lithium carbonate:
This is the first chemical in the production chain, and as a result, sells for less than lithium hydroxide. It can be used as cathode material in some batteries, such as the Nissan Leaf, where it is used in a LMO with NMC formulation (Lithium manganese oxide / nickel manganese cobalt oxide chemistries)
Lithium hydroxide:
This is a by-product of lithium carbonate, created by a metathesis reaction with calcium hydroxide. It can be used to produce cathode material more efficiently and is actually necessary for some types of cathodes. It’s used in the Tesla Powerwall and Model S, for example.
Lithium Mining
There are two basic ways to extract lithium: from brine or from hard rock. The latter mainly consists of spodumene production.
Brine deposits represent about 66% of global lithium resources, and are found mainly in the salt flats of Chile, Argentina, Bolivia, China, and Tibet.
The most famous area for lithium is known as the Lithium Triangle, located on the border between Chile, Argentina, and Bolivia. Salar de Atacama, the world’s third largest salt flat, resides on the Chilean side, and contains about 50% of global reserves.
The largest lithium producers in 2015 were Chile (37%) and Australia (33%). Argentina is the only other double-digit producer at 11%.
Lithium is Fueling the Green Revolution
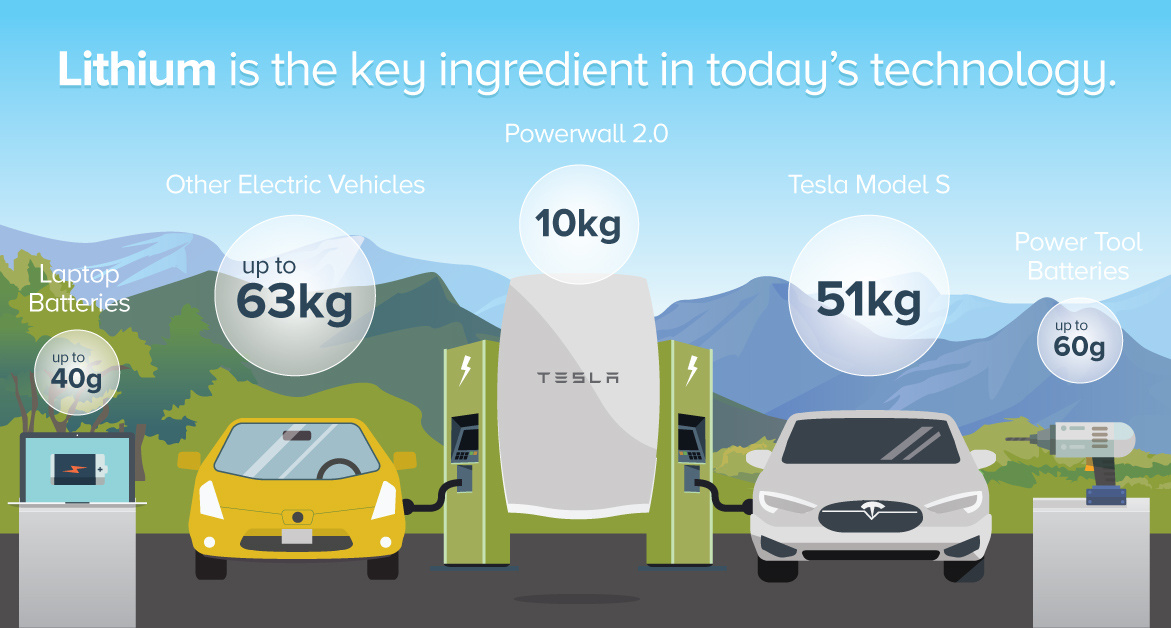
Here’s the estimated amount of lithium that can be found in everyday items using lithium-ion batteries:
Tesla Model S: 51kg
Electric Vehicles: 10-63kg
Tesla Powerwall 2.0: 10kg
Hybrids: 0.8kg to 2.0kg
Power tool batteries: 40-60g
Laptops: 30-40g
Tablets: 20-30g
Mobile phones: 2-3g

Who’s Building the Most Solar Energy?
This was originally posted on our Voronoi app. Download the app for free on iOS or Android and discover incredible data-driven charts from a variety of trusted sources.
In 2023, solar energy accounted for three-quarters of renewable capacity additions worldwide. Most of this growth occurred in Asia, the EU, and the U.S., continuing a trend observed over the past decade.
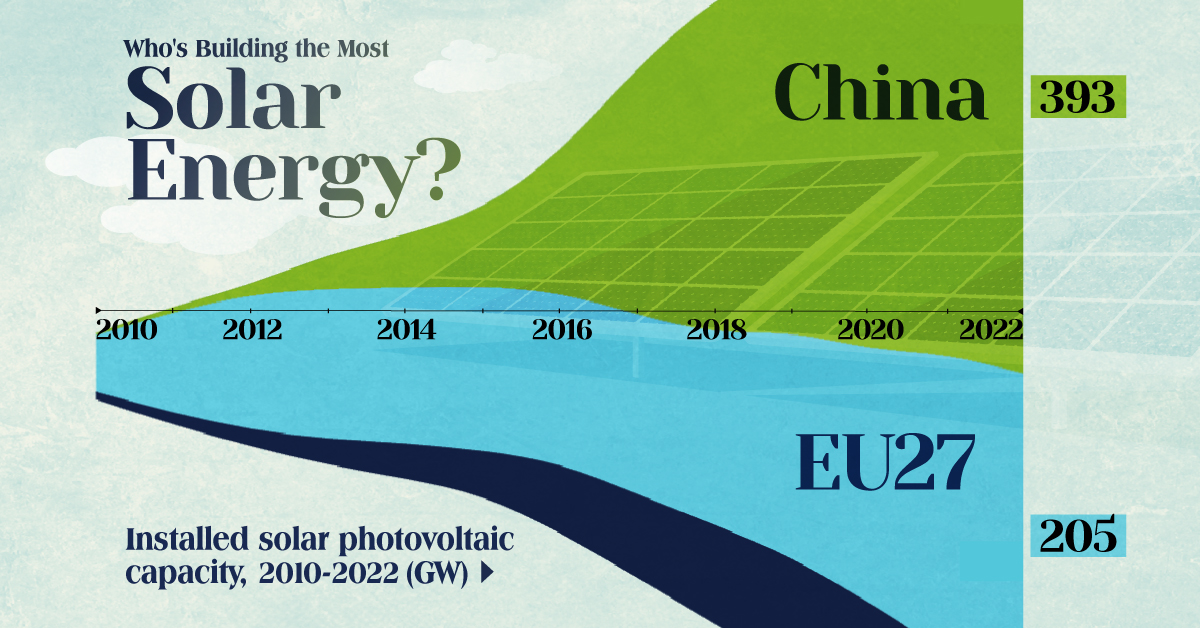
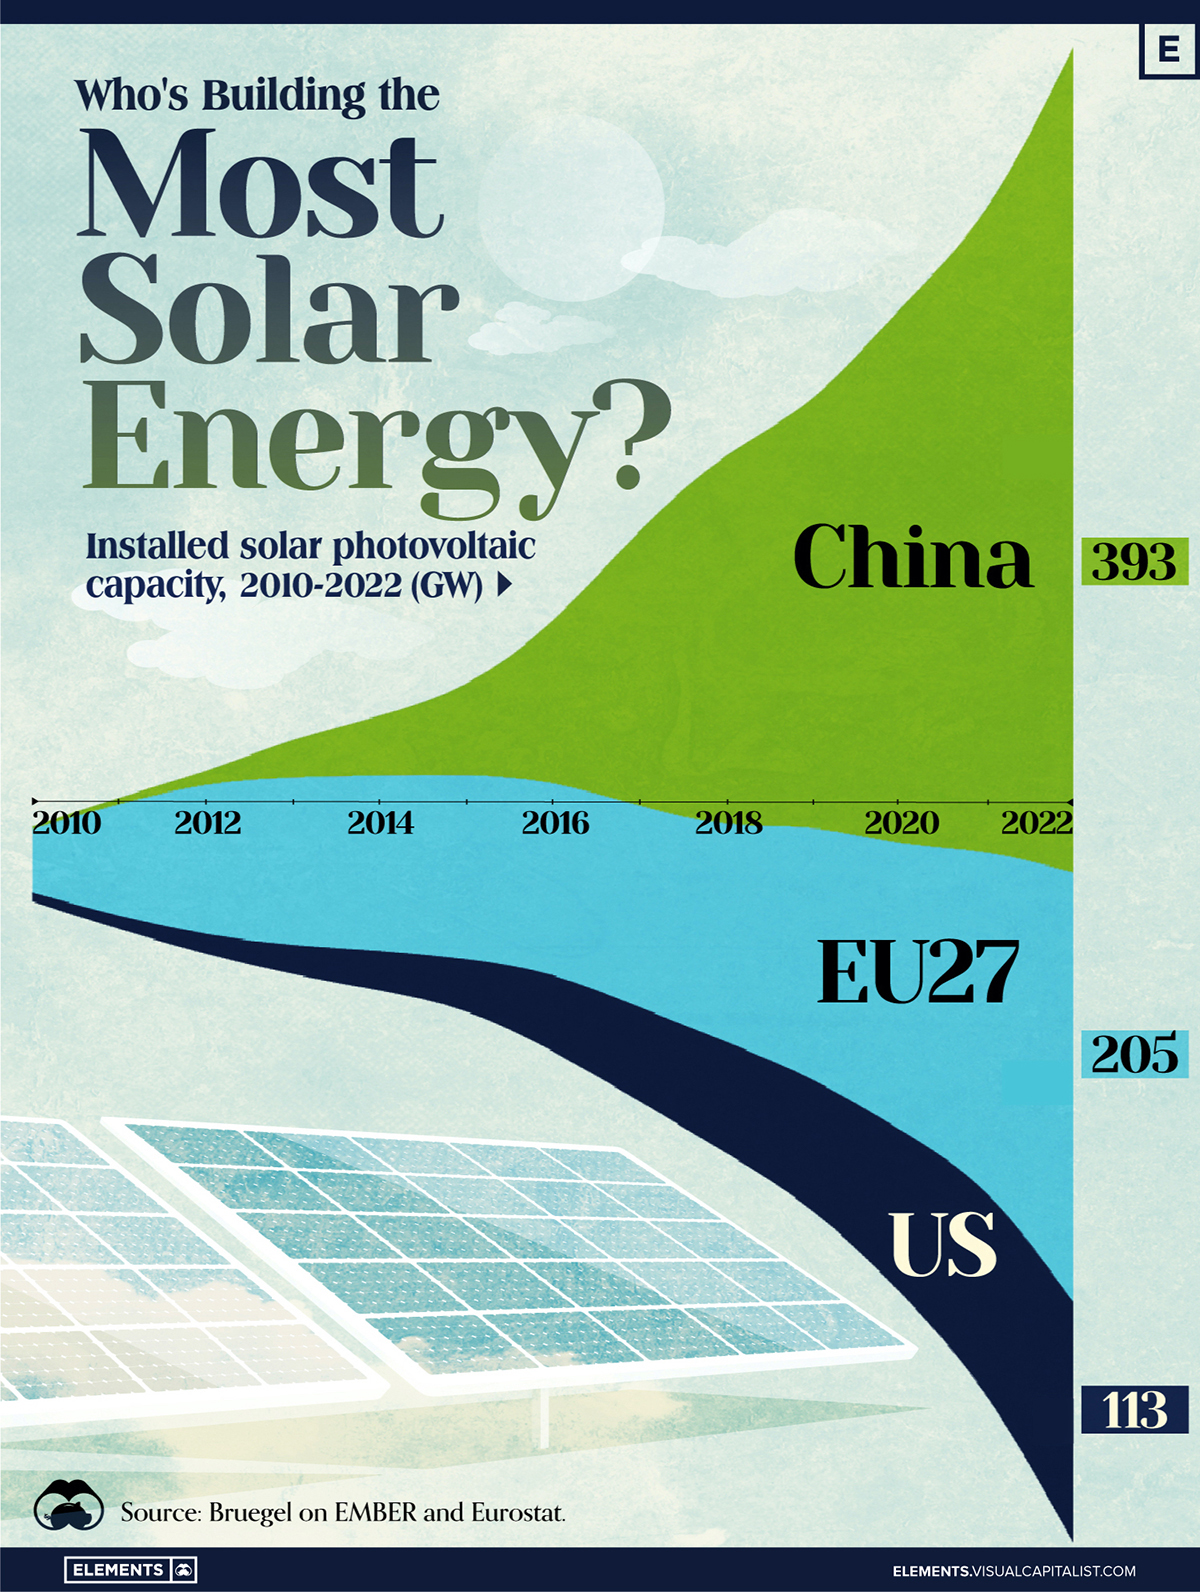
In this graphic, we illustrate the rise in installed solar photovoltaic (PV) capacity in China, the EU, and the U.S. between 2010 and 2022, measured in gigawatts (GW). Bruegel compiled the data..
Chinese Dominance
As of 2022, China’s total installed capacity stands at 393 GW, nearly double that of the EU’s 205 GW and surpassing the USA’s total of 113 GW by more than threefold in absolute terms.
| Installed solar capacity (GW) | China | EU27 | U.S. |
|---|---|---|---|
| 2022 | 393.0 | 205.5 | 113.0 |
| 2021 | 307.0 | 162.7 | 95.4 |
| 2020 | 254.0 | 136.9 | 76.4 |
| 2019 | 205.0 | 120.1 | 61.6 |
| 2018 | 175.3 | 104.0 | 52.0 |
| 2017 | 130.8 | 96.2 | 43.8 |
| 2016 | 77.8 | 91.5 | 35.4 |
| 2015 | 43.6 | 87.7 | 24.2 |
| 2014 | 28.4 | 83.6 | 18.1 |
| 2013 | 17.8 | 79.7 | 13.3 |
| 2012 | 6.7 | 71.1 | 8.6 |
| 2011 | 3.1 | 53.3 | 5.6 |
| 2010 | 1.0 | 30.6 | 3.4 |
Since 2017, China has shown a compound annual growth rate (CAGR) of approximately 25% in installed PV capacity, while the USA has seen a CAGR of 21%, and the EU of 16%.
Additionally, China dominates the production of solar power components, currently controlling around 80% of the world’s solar panel supply chain.
In 2022, China’s solar industry employed 2.76 million individuals, with manufacturing roles representing approximately 1.8 million and the remaining 918,000 jobs in construction, installation, and operations and maintenance.
The EU industry employed 648,000 individuals, while the U.S. reached 264,000 jobs.
According to the IEA, China accounts for almost 60% of new renewable capacity expected to become operational globally by 2028.
Despite the phasing out of national subsidies in 2020 and 2021, deployment of solar PV in China is accelerating. The country is expected to reach its national 2030 target for wind and solar PV installations in 2024, six years ahead of schedule.
-

 United States1 week ago
Mapped: Countries Where Recreational Cannabis is Legal
-

 Healthcare2 weeks ago
Life Expectancy by Region (1950-2050F)
-

 Markets2 weeks ago
The Growth of a $1,000 Equity Investment, by Stock Market
-

 Markets2 weeks ago
Mapped: Europe’s GDP Per Capita, by Country
-

 Money2 weeks ago
Charted: What Frustrates Americans About the Tax System
-

 Technology2 weeks ago
Countries With the Highest Rates of Crypto Ownership
-

 Mining2 weeks ago
Where the World’s Aluminum is Smelted, by Country
-

 Personal Finance2 weeks ago
Visualizing the Tax Burden of Every U.S. State


