Markets
Animation: Population Pyramids of the 10 Largest Countries
China and India may have similar populations today, but they have very different demographic destinies.
While China should see its population fall in the coming decades, India projects to be the most populous country in 2050 by a long shot. By that time, India will have up to 1.7 billion people – and Mumbai will be the largest megacity in the world with upwards of 42 million people.
Comparing Population Pyramids
These kind of future trends are not evident from the base population figures alone, but they become much clearer when we look at the population pyramids of countries instead.
Today’s animated chart comes from PopulationPyramid.net, and it shows a breakdown for each of the 10 most populous countries in the world:
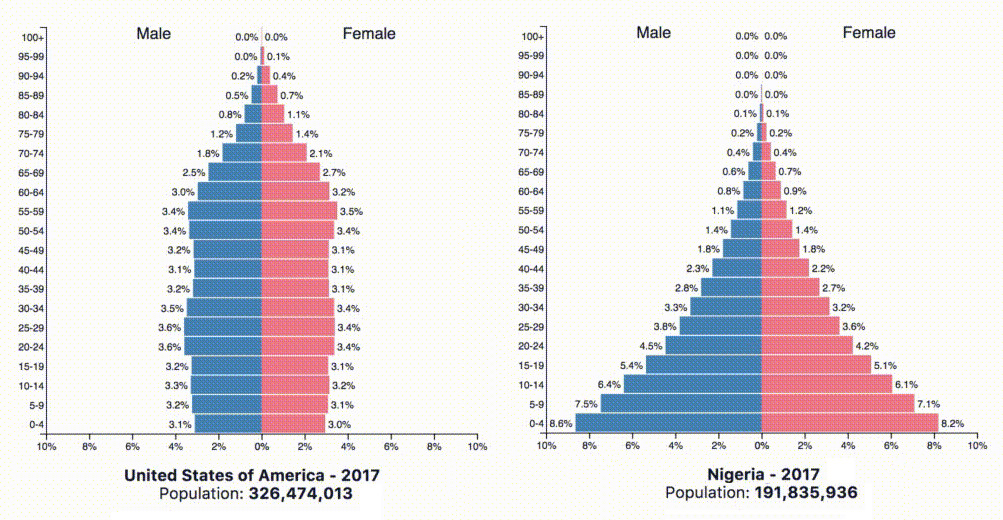
A population pyramid, which shows the distribution of a population in terms of age group and sex, can help us to see things like:
- How many people are being born?
- How long are people living?
- The age skew of the population
Analyzing these factors can give us an idea of the direction a country is trending, and whether it will continue to grow in terms of population.
Different Makeups
Below are three typical patterns for population growth: rapid, slow, and negative.
How do the population charts for the top 10 countries compare, using these kinds of classifications?
Rapid growth:
According to the above graphs, India, Indonesia, Nigeria, Mexico, Brazil, Bangladesh, and Pakistan will continue to grow their populations at a rapid pace. Nigeria is growing at a particularly fast rate, and by 2060 it will displace the U.S. as the third-largest country in the world by population.
Slow growth:
The United States stands out here as the only country in the top 10 experiencing tempered growth. That said, the U.N. sees the country hitting 400 million people around the year 2060 if trends continue.
Negative growth:
China, because of its One-Child Policy from 1979 to 2015, is not a surprise to see here.
However, Russia may be an intriguing mention in this category for many – the country has a low birth rate, a low immigration rate, and an unusually high death rate. In fact, Russia’s death rate is 15 people per 1,000 – almost twice that of the U.S. due to a high amount of alcohol-related deaths and emergencies.
Economic Progress and Population
The above classifications are mostly intuitive.
With the exception of China (and its self-inflicted wound from the One-Child Policy), the countries experiencing slower or negative growth are the ones with more mature economies.
This is something that can also be seen in this below graph:


Maps
Mapped: The 10 U.S. States With the Lowest Real GDP Growth
In this graphic, we show where real GDP lagged the most across America in 2023 as high interest rates weighed on state economies.


The Top 10 U.S. States, by Lowest Real GDP Growth
This was originally posted on our Voronoi app. Download the app for free on iOS or Android and discover incredible data-driven charts from a variety of trusted sources.
While the U.S. economy defied expectations in 2023, posting 2.5% in real GDP growth, several states lagged behind.
Last year, oil-producing states led the pack in terms of real GDP growth across America, while the lowest growth was seen in states that were more sensitive to the impact of high interest rates, particularly due to slowdowns in the manufacturing and finance sectors.
This graphic shows the 10 states with the least robust real GDP growth in 2023, based on data from the Bureau of Economic Analysis.
Weakest State Economies in 2023
Below, we show the states with the slowest economic activity in inflation-adjusted terms, using chained 2017 dollars:
| Rank | State | Real GDP Growth 2023 YoY | Real GDP 2023 |
|---|---|---|---|
| 1 | Delaware | -1.2% | $74B |
| 2 | Wisconsin | +0.2% | $337B |
| 3 | New York | +0.7% | $1.8T |
| 4 | Missississippi | +0.7% | $115B |
| 5 | Georgia | +0.8% | $661B |
| 6 | Minnesota | +1.2% | $384B |
| 7 | New Hampshire | +1.2% | $91B |
| 8 | Ohio | +1.2% | $698B |
| 9 | Iowa | +1.3% | $200B |
| 10 | Illinois | +1.3% | $876B |
| U.S. | +2.5% | $22.4T |
Delaware witnessed the slowest growth in the country, with real GDP growth of -1.2% over the year as a sluggish finance and insurance sector dampened the state’s economy.
Like Delaware, the Midwestern state of Wisconsin also experienced declines across the finance and insurance sector, in addition to steep drops in the agriculture and manufacturing industries.
America’s third-biggest economy, New York, grew just 0.7% in 2023, falling far below the U.S. average. High interest rates took a toll on key sectors, with notable slowdowns in the construction and manufacturing sectors. In addition, falling home prices and a weaker job market contributed to slower economic growth.
Meanwhile, Georgia experienced the fifth-lowest real GDP growth rate. In March 2024, Rivian paused plans to build a $5 billion EV factory in Georgia, which was set to be one of the biggest economic development initiatives in the state in history.
These delays are likely to exacerbate setbacks for the state, however, both Kia and Hyundai have made significant investments in the EV industry, which could help boost Georgia’s manufacturing sector looking ahead.

-

 Personal Finance1 week ago
Visualizing the Tax Burden of Every U.S. State
-

 Misc6 days ago
Visualized: Aircraft Carriers by Country
-

 Culture7 days ago
How Popular Snack Brand Logos Have Changed
-

 Mining1 week ago
Visualizing Copper Production by Country in 2023
-

 Misc1 week ago
Charted: How Americans Feel About Federal Government Agencies
-

 Healthcare1 week ago
Which Countries Have the Highest Infant Mortality Rates?
-

 Demographics1 week ago
Mapped: U.S. Immigrants by Region
-

 Maps1 week ago
Mapped: Southeast Asia’s GDP Per Capita, by Country