Energy
The Safest Source of Energy Will Surprise You
The World’s Safest Source of Energy Will Surprise You
When it comes to conversations on energy, it’s hard to leave your feelings at the door.
It’s arguable that energy is the single most important driver of human progress – it’s a multi-trillion dollar industry that powers our daily lives, technological advancements, and even the economic development of entire countries. At the same time, our choices around energy can have significant consequences. How we decide to generate energy can decimate the environment, fuel political conflicts, and even cause human deaths as unwelcome side effects.
The outcomes from our choices around energy are so vivid, that we’ve developed strong and polarized associations with the subject at hand.
The Empirical Perspective
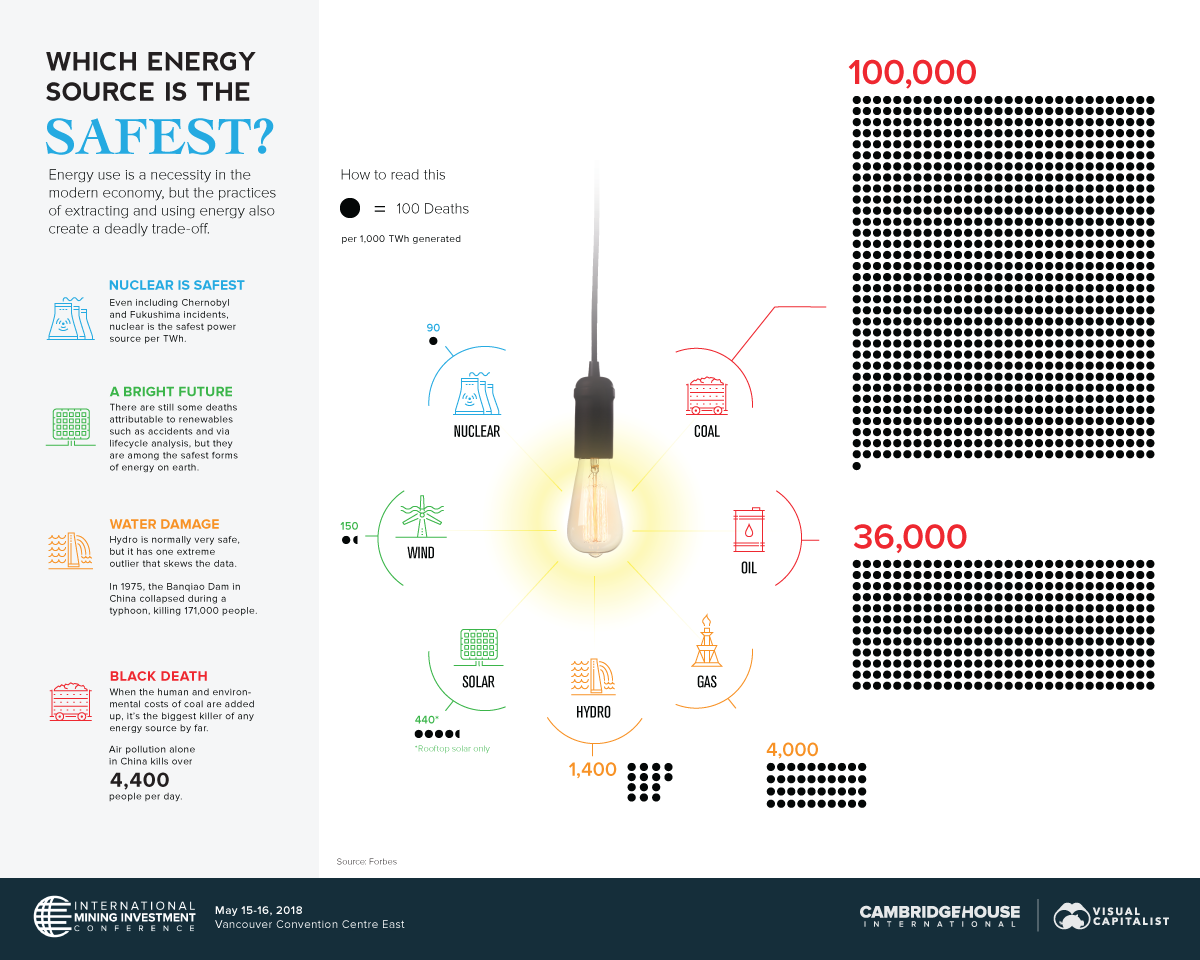
Today’s visualization on the safest sources of energy comes to us from Cambridge House, the company hosting the International Mining Investment Conference 2018 on May 15-16 in Vancouver, BC, and it uses an empirical approach to compare different energy sources with one another.
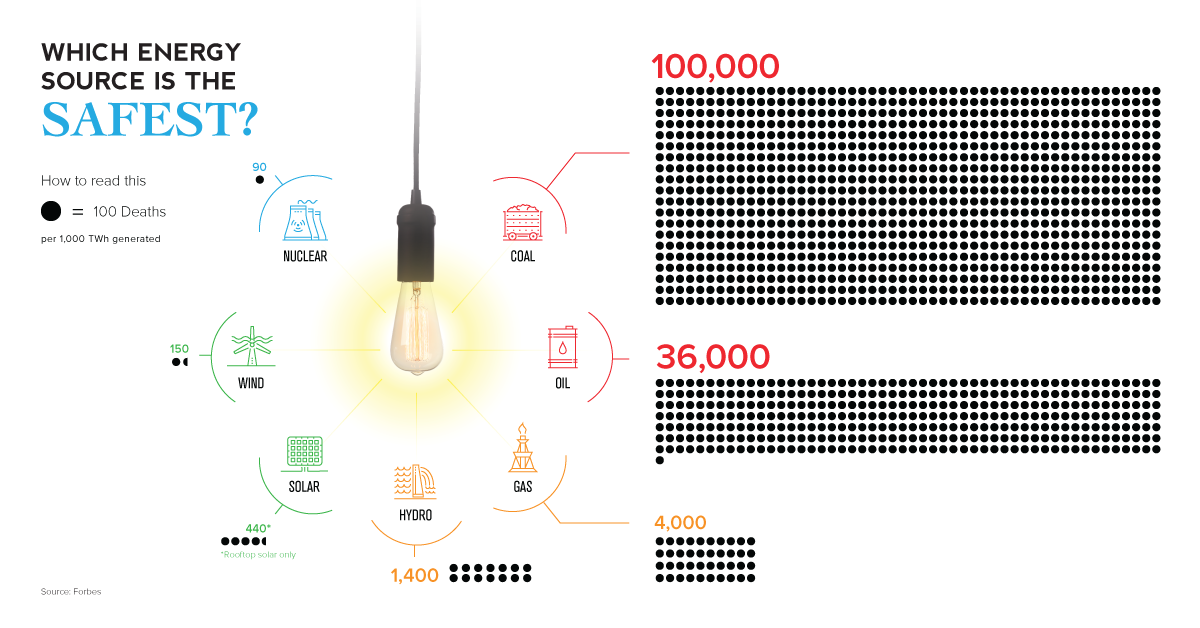
Based on the data, this comparison provides a perspective that will be surprising to many viewers. Despite its perceived dangers, nuclear is actually the safest type of energy.
| Energy Source | Deaths per 1,000 TWh | % of Global Primary Energy Supply (2015) |
|---|---|---|
| Coal | 100,000 | 28.1% |
| Oil | 36,000 | 31.7% |
| Natural Gas | 4,000 | 21.6% |
| Hydro | 1,400 | 2.5% |
| Solar | 440* | <1% |
| Wind | 150 | <1% |
| Nuclear | 90 | 4.9% |
That’s right – even when including seemingly catastrophic incidents such as Chernobyl and Fukushima in the calculations, the math says that the amount of energy generated by nuclear is so vast that it more than outweighs these incidents over the long-term.
The reality is that nuclear energy is much more comparable to renewables like solar or wind, in terms of safety. More importantly, it’s on the polar opposite of the spectrum from coal, which manages to kill 4,400 people daily in China alone.
The Nuclear Option
Interestingly, multiple studies have come to this exact same conclusion, including the ones used in an analysis by economist Max Roser’s project called Our World in Data.
Even though the conclusion on nuclear is pretty cut and dry, it’s still hard to absorb. After all, the relative safety of nuclear ends up being extremely counter-intuitive to our human brains, which are seemingly wired to put more weight on big, memorable events (i.e. Chernobyl) rather than slow, consistent deaths that occur over time with other energy sources.
Today, nuclear provides about 11% of the world’s electricity from about 450 power reactors, generating about 2,500 TWh of electricity each year.
And while there are still questions that remain – specifically revolving around how to store certain types of nuclear waste – the above data explains why the majority of scientists classify nuclear as a sustainable and safe energy source, along with other renewables.
This post originally appeared on Visual Capitalist’s new VC Metals channel, home to data-driven visual content on metals, commodities, and energy.


Who’s Building the Most Solar Energy?
This was originally posted on our Voronoi app. Download the app for free on iOS or Android and discover incredible data-driven charts from a variety of trusted sources.
In 2023, solar energy accounted for three-quarters of renewable capacity additions worldwide. Most of this growth occurred in Asia, the EU, and the U.S., continuing a trend observed over the past decade.
In this graphic, we illustrate the rise in installed solar photovoltaic (PV) capacity in China, the EU, and the U.S. between 2010 and 2022, measured in gigawatts (GW). Bruegel compiled the data..
Chinese Dominance
As of 2022, China’s total installed capacity stands at 393 GW, nearly double that of the EU’s 205 GW and surpassing the USA’s total of 113 GW by more than threefold in absolute terms.
| Installed solar capacity (GW) | China | EU27 | U.S. |
|---|---|---|---|
| 2022 | 393.0 | 205.5 | 113.0 |
| 2021 | 307.0 | 162.7 | 95.4 |
| 2020 | 254.0 | 136.9 | 76.4 |
| 2019 | 205.0 | 120.1 | 61.6 |
| 2018 | 175.3 | 104.0 | 52.0 |
| 2017 | 130.8 | 96.2 | 43.8 |
| 2016 | 77.8 | 91.5 | 35.4 |
| 2015 | 43.6 | 87.7 | 24.2 |
| 2014 | 28.4 | 83.6 | 18.1 |
| 2013 | 17.8 | 79.7 | 13.3 |
| 2012 | 6.7 | 71.1 | 8.6 |
| 2011 | 3.1 | 53.3 | 5.6 |
| 2010 | 1.0 | 30.6 | 3.4 |
Since 2017, China has shown a compound annual growth rate (CAGR) of approximately 25% in installed PV capacity, while the USA has seen a CAGR of 21%, and the EU of 16%.
Additionally, China dominates the production of solar power components, currently controlling around 80% of the world’s solar panel supply chain.
In 2022, China’s solar industry employed 2.76 million individuals, with manufacturing roles representing approximately 1.8 million and the remaining 918,000 jobs in construction, installation, and operations and maintenance.
The EU industry employed 648,000 individuals, while the U.S. reached 264,000 jobs.
According to the IEA, China accounts for almost 60% of new renewable capacity expected to become operational globally by 2028.
Despite the phasing out of national subsidies in 2020 and 2021, deployment of solar PV in China is accelerating. The country is expected to reach its national 2030 target for wind and solar PV installations in 2024, six years ahead of schedule.

-

 Personal Finance1 week ago
Visualizing the Tax Burden of Every U.S. State
-

 Misc6 days ago
Visualized: Aircraft Carriers by Country
-

 Culture6 days ago
How Popular Snack Brand Logos Have Changed
-

 Mining1 week ago
Visualizing Copper Production by Country in 2023
-

 Misc1 week ago
Charted: How Americans Feel About Federal Government Agencies
-

 Healthcare1 week ago
Which Countries Have the Highest Infant Mortality Rates?
-

 Demographics1 week ago
Mapped: U.S. Immigrants by Region
-

 Maps1 week ago
Mapped: Southeast Asia’s GDP Per Capita, by Country