Wealth
Who are the World’s Richest Monarchs?
![]() See this visualization first on the Voronoi app.
See this visualization first on the Voronoi app.
Who Are the World’s Richest Monarchs?
This was originally posted on our Voronoi app. Download the app for free on iOS or Android and discover incredible data-driven charts from a variety of trusted sources.
They’re the original wealthy, the original elite—coming from long lines of succession that sat atop the economy and society of entire nations. And even in a world of democracies, and the democratization of wealth, the world’s surviving monarchs still have extensive access to real estate, company holdings, stock ownership, and of course, money.
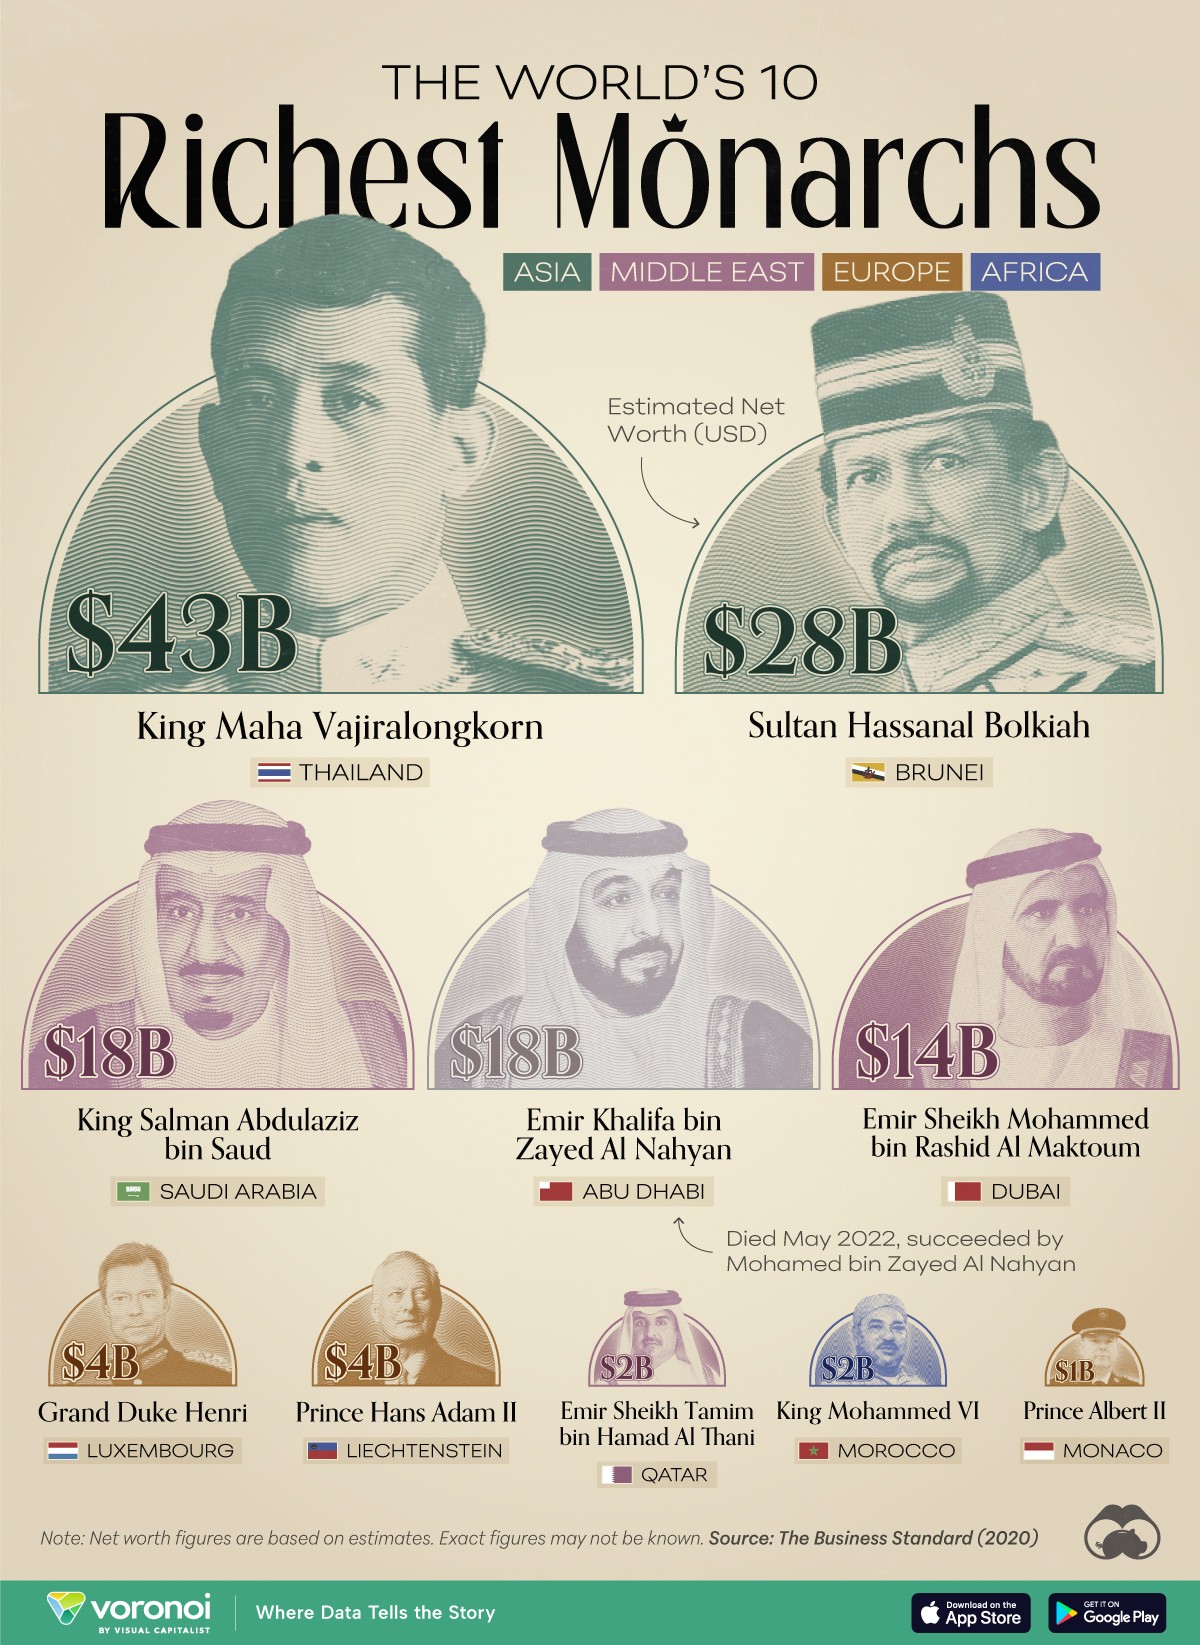
We visualize the world’s 10 richest monarchs, based on estimates compiled by The Business Standard, a news platform based in Bangladesh.
Ranked: The World’s Richest Monarchs
Ranked first, the world’s richest monarch, is King Maha Vajiralongkorn from Thailand, with a net worth of $43 billion. This extraordinary wealth comes from stakes in real estate in Bangkok, as well as ownership in the country’s largest cement company and bank. For 80 years Thailand’s monarch’s royal assets were managed by Crown Property Bureau until they were transferred directly to the reigning King himself in 2016.
In 2018, this became a key issue in the wave of student protests in the country, which also questioned the “excessive royal budget.”
Here is the full list of the world’s richest monarchs, as estimated by The Business Standard.
| Rank | Country | Name | Estimated Net Worth (USD billions) |
|---|---|---|---|
| 1 | 🇹🇭 Thailand | King Maha Vajiralongkorn | $43 |
| 2 | 🇧🇳 Brunei | Sultan Hassanal Bolkiah | $28 |
| 3 | 🇸🇦 Saudi Arabia | King Salman Abdulaziz bin Saud | $18 |
| 4 | 🇦🇪 Abu Dhabi | Emir Khalifa bin Zayed Al Nahyan | $18 |
| 5 | 🇦🇪 Dubai | Emir Sheikh Mohammed bin Rashid Al Maktoum | $14 |
| 6 | 🇱🇺 Luxembourg | Grand Duke Henri | $4 |
| 7 | 🇱🇮 Liechtenstein | Prince Hans Adam II | $4 |
| 8 | 🇶🇦 Qatar | Emir Sheikh Tamim bin Hamad Al Thani | $2 |
| 9 | 🇲🇦 Morocco | King Mohammed VI | $2 |
| 10 | 🇲🇨 Monaco | Prince Albert II | $1 |
The Sultan of Brunei, Sultan Hassanal Bolkiah, is the second richest monarch, with an estimated net worth of $28 billion. Most of this wealth is sourced from oil and gas investments—the sector is a mainstay of the country’s economy, and half of Brunei’s GDP relies on oil revenues. The monarch likes to spend his vast wealth on several luxuries, including a massive collection of 7,000 cars worth over $5 billion, and several private jets.
Ranked third to fifth are three Middle Eastern monarchs—King Salman bin Saud (Saudi Arabia), Sheikh Khalifa bin Zayed Al Nahyan (Abu Dhabi), and Sheikh Mohammed bin Rashid Al Maktoum (Dubai)—with wealth ranges between $14 billion and $18 billion. As an update to the source’s findings, Sheikh Khalifa bin Zayed Al Nahyan passed away in May 2022 (after this data was compiled), and was succeeded by Mohamed bin Zayed Al Nahyan.
European monarchs, from Luxembourg and Liechtenstein, are the next richest—though their wealth numbers in the single-digit billions—followed by the Qatari and Moroccan monarchs. Prince Albert II from Monaco rounds out the top 10, with an estimated wealth of $1 billion.
Wealth estimates can often be hard to accurately summarize and often fluctuate with the value of holdings. Furthermore, depending the source, the top 10 can also include King Charles III and Juan Carlos I, the former King of Spain, both estimated at $2 billion.


Personal Finance
Visualizing the Tax Burden of Every U.S. State
Tax burden measures the percent of an individual’s income that is paid towards taxes. See where it’s the highest by state in this graphic.


Visualizing the Tax Burden of Every U.S. State
This was originally posted on our Voronoi app. Download the app for free on iOS or Android and discover incredible data-driven charts from a variety of trusted sources.
This map graphic visualizes the total tax burden in each U.S. state as of March 2024, based on figures compiled by WalletHub.
It’s important to understand that under this methodology, the tax burden measures the percent of an average person’s income that is paid towards state and local taxes. It considers property taxes, income taxes, and sales & excise tax.
Data and Methodology
The figures we used to create this graphic are listed in the table below.
| State | Total Tax Burden |
|---|---|
| New York | 12.0% |
| Hawaii | 11.8% |
| Vermont | 11.1% |
| Maine | 10.7% |
| California | 10.4% |
| Connecticut | 10.1% |
| Minnesota | 10.0% |
| Illinois | 9.7% |
| New Jersey | 9.5% |
| Rhode Island | 9.4% |
| Utah | 9.4% |
| Kansas | 9.3% |
| Maryland | 9.3% |
| Iowa | 9.2% |
| Nebraska | 9.2% |
| Ohio | 8.9% |
| Indiana | 8.9% |
| Arkansas | 8.8% |
| Mississippi | 8.8% |
| Massachusetts | 8.6% |
| Virginia | 8.5% |
| West Virginia | 8.5% |
| Oregon | 8.4% |
| Colorado | 8.4% |
| Pennsylvania | 8.4% |
| Wisconsin | 8.3% |
| Louisiana | 8.3% |
| Kentucky | 8.3% |
| Washington | 8.0% |
| New Mexico | 8.0% |
| Michigan | 8.0% |
| North Carolina | 7.9% |
| Idaho | 7.9% |
| Arizona | 7.8% |
| Missouri | 7.8% |
| Georgia | 7.7% |
| Texas | 7.6% |
| Alabama | 7.5% |
| Montana | 7.5% |
| South Carolina | 7.5% |
| Nevada | 7.4% |
| Oklahoma | 7.0% |
| North Dakota | 6.8% |
| South Dakota | 6.4% |
| Delaware | 6.4% |
| Tennessee | 6.1% |
| Florida | 6.1% |
| Wyoming | 5.7% |
| New Hampshire | 5.6% |
| Alaska | 4.9% |
From this data we can see that New York has the highest total tax burden. Residents in this state will pay, on average, 12% of their income to state and local governments.
Breaking this down into its three components, the average New Yorker pays 4.6% of their income on income taxes, 4.4% on property taxes, and 3% in sales & excise taxes.
At the other end of the spectrum, Alaska has the lowest tax burden of any state, equaling 4.9% of income. This is partly due to the fact that Alaskans do not pay state income tax.
Hate Paying Taxes?
In addition to Alaska, there are several other U.S. states that don’t charge income taxes. These are: Florida, Nevada, South Dakota, Tennessee, Texas, Washington, and Wyoming.
It’s also worth noting that New Hampshire does not have a regular income tax, but does charge a flat 4% on interest and dividend income according to the Tax Foundation.
Learn More About Taxation From Visual Capitalist
If you enjoyed this post, be sure to check out this graphic which ranks the countries with the lowest corporate tax rates, from 1980 to today.

-

 Personal Finance1 week ago
Visualizing the Tax Burden of Every U.S. State
-

 Misc6 days ago
Visualized: Aircraft Carriers by Country
-

 Culture6 days ago
How Popular Snack Brand Logos Have Changed
-

 Mining1 week ago
Visualizing Copper Production by Country in 2023
-

 Politics1 week ago
Charted: How Americans Feel About Federal Government Agencies
-

 Healthcare1 week ago
Which Countries Have the Highest Infant Mortality Rates?
-

 Demographics1 week ago
Mapped: U.S. Immigrants by Region
-

 Economy1 week ago
Mapped: Southeast Asia’s GDP Per Capita, by Country