Technology
Visualizing Global Attitudes Towards AI
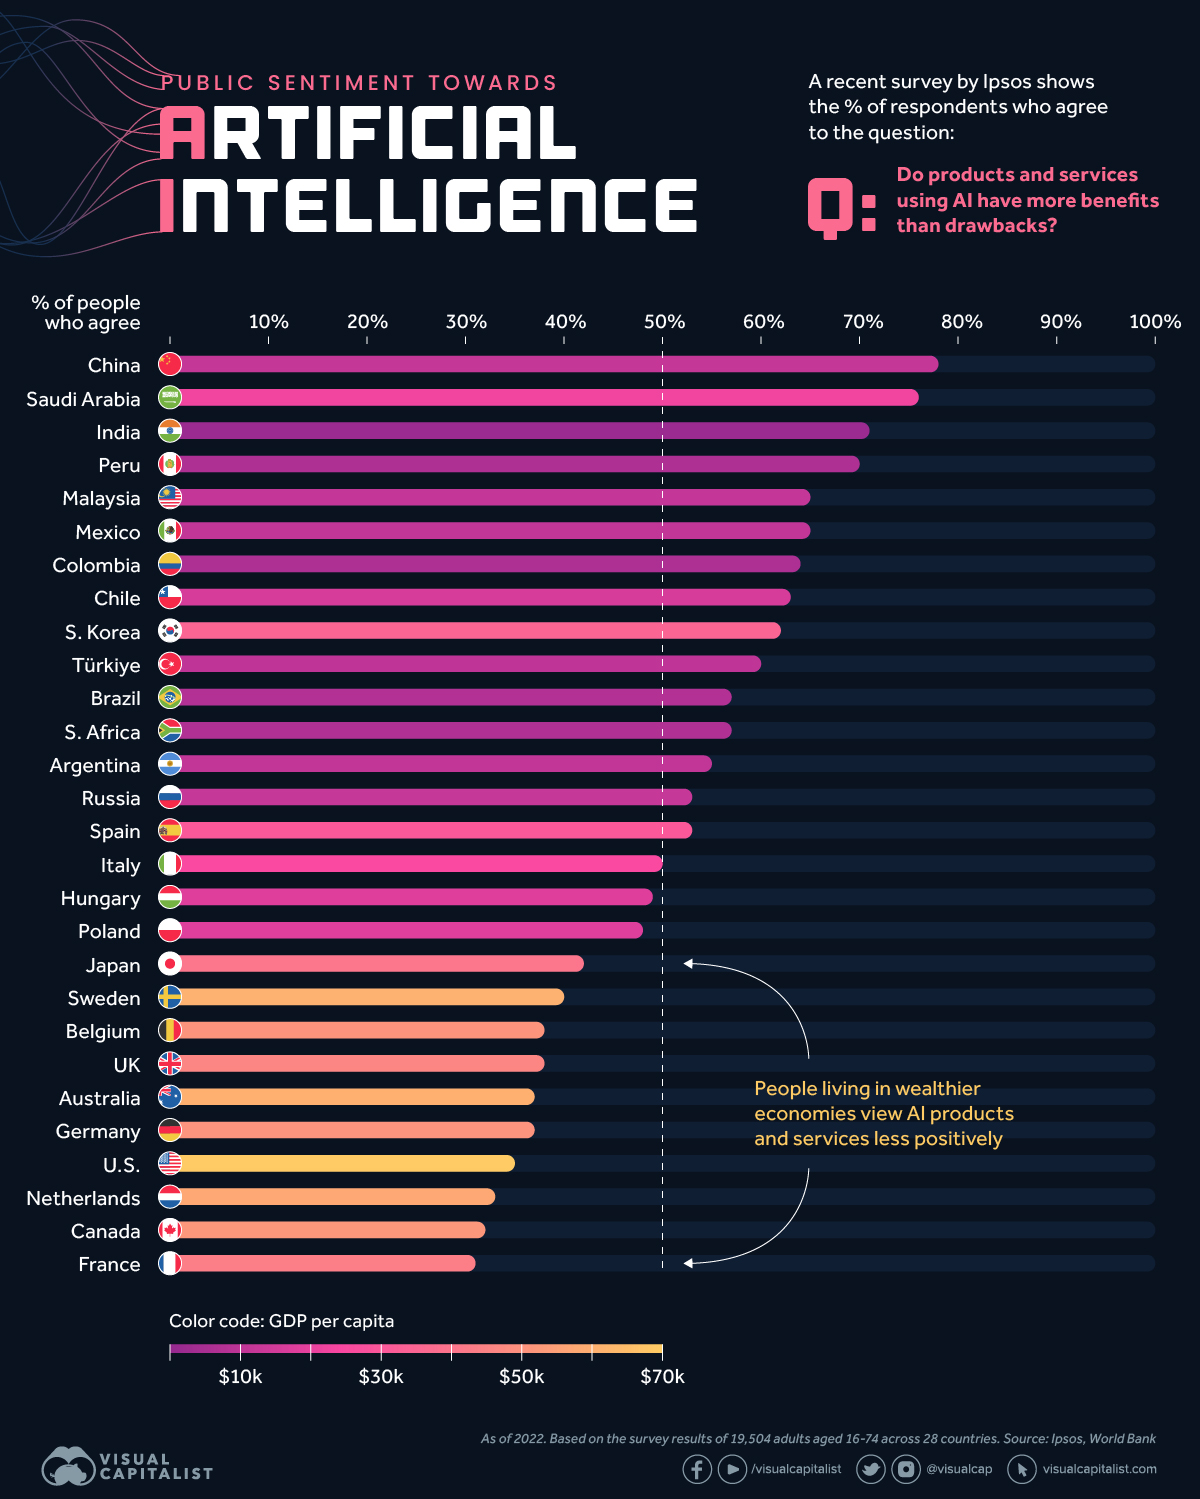
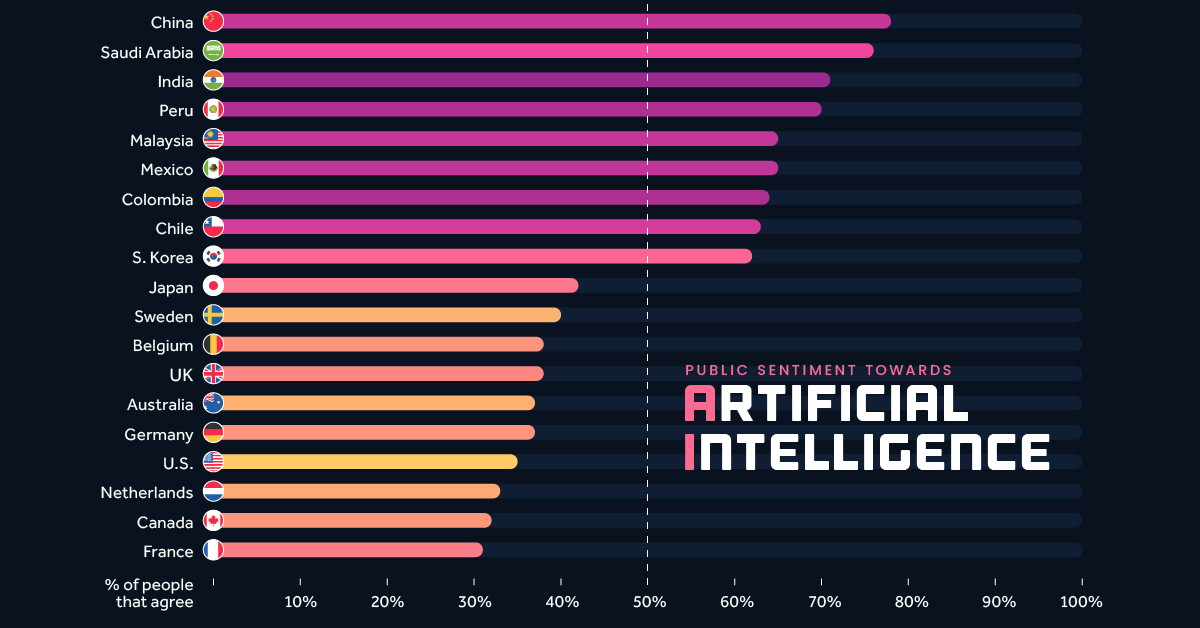
Comparing Public Sentiment Towards AI, by Country
Artificial intelligence (AI) is one of the fastest growing and most disruptive technologies in the world today. Because it has the potential to drastically impact society, it’s important to measure how people are feeling towards it.
This infographic visualizes survey data from market research firm, Ipsos, to see how attitudes towards AI varies by country. By including each country’s GDP per capita, we can see that wealthier populations are more skeptical about products and services that use the technology.
Data and Methodology
This data is based on a 28-country survey of 19,504 adults aged 18 to 74. Polling took place between November and December 2021, and the results were published in January 2022.
This survey took place before the recent explosion in popularity of generative AI tools such as ChatGPT, DALL-E, and Midjourney, but forms the foundation for how people view this rapidly improving technology.
The table below lists the percentage of respondents who agreed with the following statement:
“Products and services using artificial intelligence have more benefits than drawbacks”
| Country | % Agreeing With Statement | GDP per capita |
|---|---|---|
| China | 78% | $12,556 |
| Saudi Arabia | 76% | $23,186 |
| India | 71% | $2,257 |
| Peru | 70% | $6,622 |
| Malaysia | 65% | $11,109 |
| Mexico | 65% | $10,046 |
| Colombia | 64% | $6,104 |
| Chile | 63% | $16,265 |
| South Korea | 62% | $34,998 |
| Türkiye | 60% | $9,661 |
| Brazil | 57% | $7,507 |
| South Africa | 57% | $7,055 |
| Argentina | 55% | $10,636 |
| Russia | 53% | $12,195 |
| Spain | 53% | $30,104 |
| Italy | 50% | $35,658 |
| Hungary | 49% | $18,728 |
| Poland | 48% | $18,000 |
| Japan | 42% | $39,313 |
| Sweden | 40% | $61,029 |
| Belgium | 38% | $51,247 |
| UK | 38% | $46,510 |
| Australia | 37% | $60,443 |
| Germany | 37% | $51,203 |
| United States | 35% | $70,249 |
| Netherlands | 33% | $57,768 |
| Canada | 32% | $51,988 |
| France | 31% | $43,659 |
GDP per capita as of 2021. Source: World Bank
Ipsos notes that their samples from developing economies like China and India were “more urban, more educated, and more affluent than the general population”. Thus, the results for these countries likely reflect the more tech-savvy segments of their population.
Further Survey Results
Respondents were asked additional questions about AI, which we’ve included in the tables below. Let’s start with this statement:
“Products and services using artificial intelligence make my life easier”
| Country | % Agreeing With Statement | GDP per capita |
|---|---|---|
| China | 87% | $12,556 |
| Saudi Arabia | 80% | $23,186 |
| Peru | 74% | $6,622 |
| South Korea | 74% | $34,998 |
| Mexico | 73% | $10,046 |
| India | 72% | $2,257 |
| Colombia | 71% | $6,104 |
| Malaysia | 71% | $11,109 |
| Türkiye | 71% | $9,661 |
| Chile | 70% | $16,265 |
| South Africa | 67% | $7,055 |
| Brazil | 65% | $7,507 |
| Russia | 64% | $12,195 |
| Argentina | 59% | $10,636 |
| Spain | 59% | $30,104 |
| Poland | 58% | $18,000 |
| Italy | 54% | $35,658 |
| Japan | 52% | $39,313 |
| Hungary | 50% | $18,728 |
| Belgium | 49% | $51,247 |
| Netherlands | 47% | $57,768 |
| Australia | 46% | $60,443 |
| Sweden | 46% | $61,029 |
| Germany | 45% | $51,203 |
| UK | 45% | $46,510 |
| Canada | 44% | $51,988 |
| United States | 41% | $70,249 |
| France | 39% | $43,659 |
As expected, we see a similar trend as in the previous question’s results. It seems that developing countries are embracing AI to greater lengths.
Next, we’ll look at a more forward-looking statement:
“Products and services using AI will profoundly change my daily life in the next 3-5 years”.
| Country | % Agreeing With Statement | GDP per capita |
|---|---|---|
| China | 80% | $12,556 |
| Saudi Arabia | 80% | $23,186 |
| South Korea | 76% | $34,998 |
| India | 74% | $2,257 |
| Türkiye | 73% | $9,661 |
| South Africa | 72% | $7,055 |
| Malaysia | 71% | $11,109 |
| Peru | 71% | $6,622 |
| Chile | 67% | $16,265 |
| Colombia | 65% | $6,104 |
| Mexico | 65% | $10,046 |
| Brazil | 61% | $7,507 |
| Argentina | 60% | $10,636 |
| Russia | 60% | $12,195 |
| Poland | 56% | $18,000 |
| Spain | 56% | $30,104 |
| Hungary | 55% | $18,728 |
| Italy | 53% | $35,658 |
| Japan | 53% | $39,313 |
| Netherlands | 53% | $57,768 |
| Belgium | 52% | $51,247 |
| Australia | 50% | $60,443 |
| Sweden | 50% | $61,029 |
| UK | 46% | $46,510 |
| United States | 46% | $70,249 |
| France | 45% | $43,659 |
| Canada | 44% | $51,988 |
| Germany | 44% | $51,203 |
Once again, populations from wealthier countries are at the lower end of the results. This could be due to societal factors (differing attitudes towards technology), economic structure, or some combination of both.
To elaborate on economic structure, let’s look at the world’s two biggest economies, the U.S. and China. The following table shows the distribution of each country’s workforce across the three major sectors.
| Economic Sector | U.S. | China |
|---|---|---|
| Agriculture | 1% | 25% |
| Industry | 20% | 28% |
| Services | 79% | 47% |
As of 2019. Source: Statista
Developing economies such as China have a larger proportion of agricultural and industrial employment, while advanced economies like the U.S. are typically more services oriented. Structural differences such as these could have an impact on how a population views AI.
Technology
Charting the Next Generation of Internet
In this graphic, Visual Capitalist has partnered with MSCI to explore the potential of satellite internet as the next generation of internet innovation.
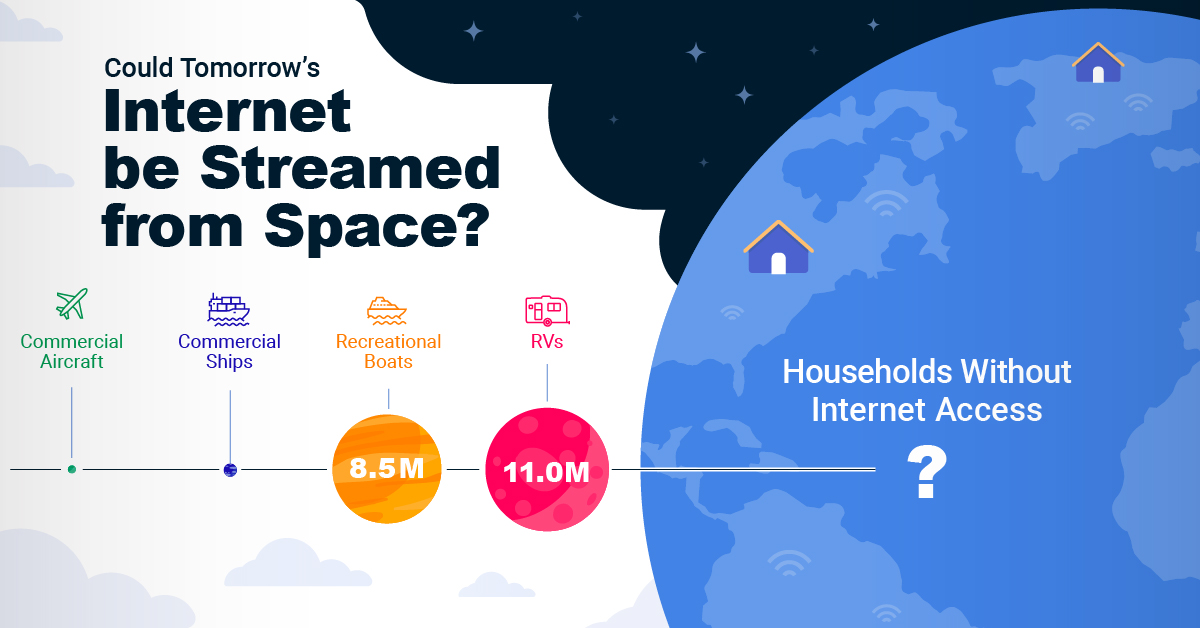
Could Tomorrow’s Internet be Streamed from Space?
In 2023, 2.6 billion people could not access the internet. Today, companies worldwide are looking to innovative technology to ensure more people are online at the speed of today’s technology.
Could satellite internet provide the solution?
In collaboration with MSCI, we embarked on a journey to explore whether tomorrow’s internet could be streamed from space.
Satellite Internet’s Potential Customer Base
Millions of people live in rural communities or mobile homes, and many spend much of their lives at sea or have no fixed abode. So, they cannot access the internet simply because the technology is unavailable.
Satellite internet gives these communities access to the internet without requiring a fixed location. Consequently, the volume of people who could get online using satellite internet is significant:
| Area | Potential Subscribers |
|---|---|
| Households Without Internet Access | 600,000,000 |
| RVs | 11,000,000 |
| Recreational Boats | 8,500,000 |
| Ships | 100,000 |
| Commercial Aircraft | 25,000 |
Advances in Satellite Technology
Satellite internet is not a new concept. However, it has only recently been that roadblocks around cost and long turnaround times have been overcome.
NASA’s space shuttle, until it was retired in 2011, was the only reusable means of transporting crew and cargo into orbit. It cost over $1.5 billion and took an average of 252 days to launch and refurbish.
In stark contrast, SpaceX’s Falcon 9 can now launch objects into orbit and maintain them at a fraction of the time and cost, less than 1% of the space shuttle’s cost.
| Average Rocket Turnaround Time | Average Launch/Refurbishment Cost | |
|---|---|---|
| Falcon 9* | 21 days | < $1,000,000 |
| Space Shuttle | 252 days | $1,500,000,000 (approximately) |
Satellites are now deployed 300 miles in low Earth orbit (LEO) rather than 22,000 miles above Earth in Geostationary Orbit (GEO), previously the typical satellite deployment altitude.
What this means for the consumer is that satellite internet streamed from LEO has a latency of 40 ms, which is an optimal internet connection. Especially when compared to the 700 ms stream latency experienced with satellite internet streamed from GEO.
What Would it Take to Build a Satellite Internet?
SpaceX, the private company that operates Starlink, currently has 4,500 satellites. However, the company believes it will require 10 times this number to provide comprehensive satellite internet coverage.
Charting the number of active satellites reveals that, despite the increasing number of active satellites, many more must be launched to create a comprehensive satellite internet.
| Year | Number of Active Satellites |
|---|---|
| 2022 | 6,905 |
| 2021 | 4,800 |
| 2020 | 3,256 |
| 2019 | 2,272 |
| 2018 | 2,027 |
| 2017 | 1,778 |
| 2016 | 1,462 |
| 2015 | 1,364 |
| 2014 | 1,262 |
| 2013 | 1,187 |
Next-Generation Internet Innovation
Innovation is at the heart of the internet’s next generation, and the MSCI Next Generation Innovation Index exposes investors to companies that can take advantage of potentially disruptive technologies like satellite internet.
You can gain exposure to companies advancing access to the internet with four indexes:
- MSCI ACWI IMI Next Generation Internet Innovation Index
- MSCI World IMI Next Generation Internet Innovation 30 Index
- MSCI China All Shares IMI Next Generation Internet Innovation Index
- MSCI China A Onshore IMI Next Generation Internet Innovation Index
MSCI thematic indexes are objective, rules-based, and regularly updated to focus on specific emerging trends that could evolve.

Click here to explore the MSCI thematic indexes

-

 Technology1 week ago
Countries With the Highest Rates of Crypto Ownership
While the U.S. is a major market for cryptocurrencies, two countries surpass it in terms of their rates of crypto ownership.
-

 Technology2 weeks ago
Mapped: The Number of AI Startups By Country
Over the past decade, thousands of AI startups have been funded worldwide. See which countries are leading the charge in this map graphic.
-

 Technology3 weeks ago
All of the Grants Given by the U.S. CHIPS Act
Intel, TSMC, and more have received billions in subsidies from the U.S. CHIPS Act in 2024.
-

 Technology3 weeks ago
Visualizing AI Patents by Country
See which countries have been granted the most AI patents each year, from 2012 to 2022.
-

 Technology4 weeks ago
How Tech Logos Have Evolved Over Time
From complete overhauls to more subtle tweaks, these tech logos have had quite a journey. Featuring: Google, Apple, and more.
-

 AI1 month ago
Ranked: Semiconductor Companies by Industry Revenue Share
Nvidia is coming for Intel’s crown. Samsung is losing ground. AI is transforming the space. We break down revenue for semiconductor companies.
-

 Technology1 week ago
Countries With the Highest Rates of Crypto Ownership
-

 Mining7 days ago
Visualizing Copper Production by Country in 2023
-

 Politics7 days ago
Charted: How Americans Feel About Federal Government Agencies
-

 Healthcare1 week ago
Which Countries Have the Highest Infant Mortality Rates?
-

 Demographics1 week ago
Mapped: U.S. Immigrants by Region
-

 Economy1 week ago
Mapped: Southeast Asia’s GDP Per Capita, by Country
-
 Automotive1 week ago
How People Get Around in America, Europe, and Asia
-

 Personal Finance1 week ago
Visualizing the Tax Burden of Every U.S. State


