Markets
Charted: The U.S. Mortgage Rate vs. Existing Home Sales
The U.S. Mortgage Rate vs. Existing Home Sales
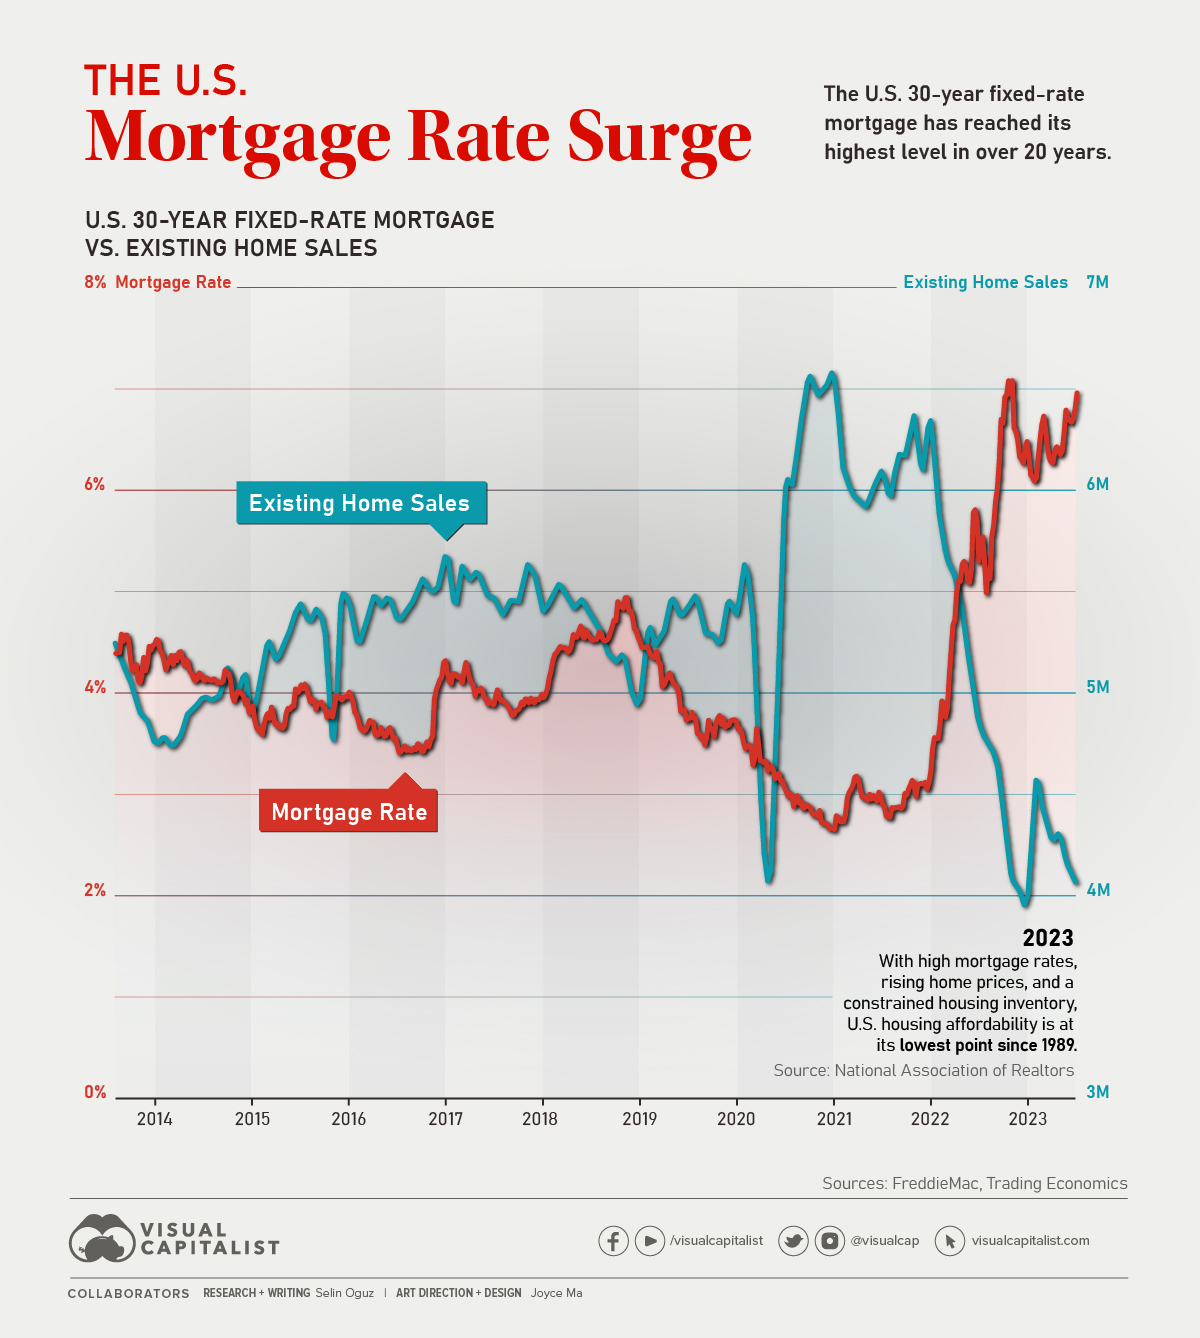
The U.S. 30-year fixed-rate mortgage has reached its highest level since 2002.
Coupled with rising home prices and a constrained housing inventory, U.S. housing affordability is now at its lowest point since 1989, according to the National Association of Realtors.
In the graphic above, we take a closer look at how the U.S. 30-year fixed-rate mortgage has evolved since 2013 against the backdrop of existing home sales, using data from both Freddie Mac and Trading Economics.
A Decade in Review: U.S. 30-Year Fixed-Rate Mortgages
Due to the stability and predictability they offer, fixed-rate mortgages remain very popular among American homebuyers. In 2021, 30-year fixed-rate mortgages made up 70% of all issued mortgages in the country.
Let’s take a look at how U.S. 30-year mortgage rates have evolved through the years.
| Year | Average 30-Year Fixed-Rate Mortgage |
|---|---|
| 2023 (Year-to-Date) | 6.65% |
| 2022 | 5.34% |
| 2021 | 2.96% |
| 2020 | 3.11% |
| 2019 | 3.94% |
| 2018 | 4.54% |
| 2017 | 3.99% |
| 2016 | 3.65% |
| 2015 | 3.85% |
| 2014 | 4.17% |
In the last few years alone, Americans have seen 30-year fixed-rate mortgages hit their lowest point in U.S. history—2.65% in January 2021—as well as skyrocket to their current rate of 7.31% (as of October 3, 2023.)
Naturally, this surge may leave many people wondering about the reasons behind this drastic change and whether they will drop any time soon.
Why Do Mortgage Rates Rise?
Mortgage rates rise in response to various economic indicators and policy changes.
Over the years, factors such as shifts in the Federal Reserve’s monetary policy, inflation concerns, the state of the bond market, and fluctuations in economic growth have all played roles in influencing mortgage rates.
2023 is no different, with many different economic and global events at play. It’s also notable that these high mortgage rates are affecting home sales in the U.S., specifically with existing home sales taking a dip while new home sales subtly rise.
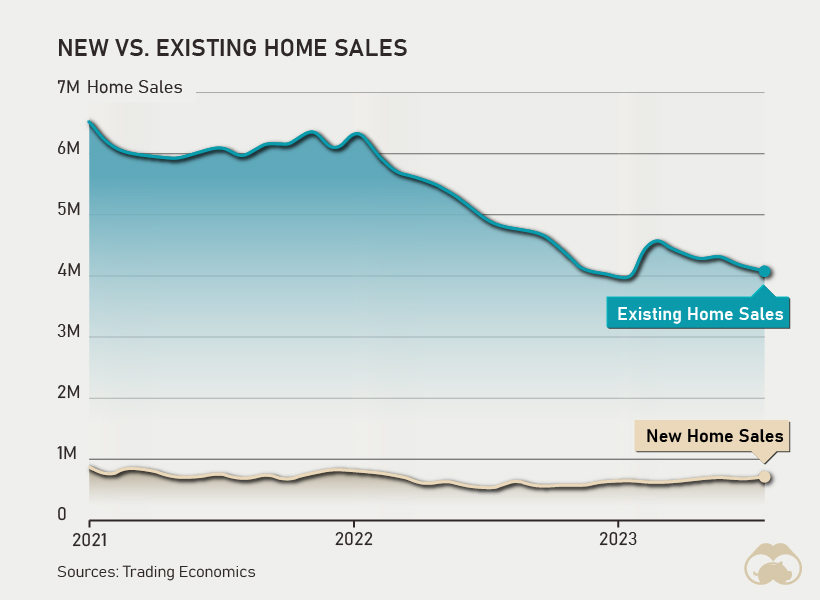
This change in dynamics is occurring as homeowners with low mortgage rates hesitate to sell their homes and get back in the market amidst high mortgage rates. In turn, demand from buyers is increasing new home sales and pushing prices even higher.
What’s In Store for U.S. Mortgage Rates?
U.S. mortgage rates remain above 7% for the time being. However, experts suggest that rates may have already peaked and will likely start to fall in the coming months as recession fears subside and the economy regains its momentum.
The Mortgage Bankers Association estimates that the U.S. 30-year fixed-rate mortgage will fall to 6.3% by the end of 2023 and 5.4% by the end of 2024. Based on these predictions, it’s likely that the rates that characterized 2020 and 2021 will not be returning for some time to come, despite their downward trend.


Maps
Mapped: The 10 U.S. States With the Lowest Real GDP Growth
In this graphic, we show where real GDP lagged the most across America in 2023 as high interest rates weighed on state economies.


The Top 10 U.S. States, by Lowest Real GDP Growth
This was originally posted on our Voronoi app. Download the app for free on iOS or Android and discover incredible data-driven charts from a variety of trusted sources.
While the U.S. economy defied expectations in 2023, posting 2.5% in real GDP growth, several states lagged behind.
Last year, oil-producing states led the pack in terms of real GDP growth across America, while the lowest growth was seen in states that were more sensitive to the impact of high interest rates, particularly due to slowdowns in the manufacturing and finance sectors.
This graphic shows the 10 states with the least robust real GDP growth in 2023, based on data from the Bureau of Economic Analysis.
Weakest State Economies in 2023
Below, we show the states with the slowest economic activity in inflation-adjusted terms, using chained 2017 dollars:
| Rank | State | Real GDP Growth 2023 YoY | Real GDP 2023 |
|---|---|---|---|
| 1 | Delaware | -1.2% | $74B |
| 2 | Wisconsin | +0.2% | $337B |
| 3 | New York | +0.7% | $1.8T |
| 4 | Missississippi | +0.7% | $115B |
| 5 | Georgia | +0.8% | $661B |
| 6 | Minnesota | +1.2% | $384B |
| 7 | New Hampshire | +1.2% | $91B |
| 8 | Ohio | +1.2% | $698B |
| 9 | Iowa | +1.3% | $200B |
| 10 | Illinois | +1.3% | $876B |
| U.S. | +2.5% | $22.4T |
Delaware witnessed the slowest growth in the country, with real GDP growth of -1.2% over the year as a sluggish finance and insurance sector dampened the state’s economy.
Like Delaware, the Midwestern state of Wisconsin also experienced declines across the finance and insurance sector, in addition to steep drops in the agriculture and manufacturing industries.
America’s third-biggest economy, New York, grew just 0.7% in 2023, falling far below the U.S. average. High interest rates took a toll on key sectors, with notable slowdowns in the construction and manufacturing sectors. In addition, falling home prices and a weaker job market contributed to slower economic growth.
Meanwhile, Georgia experienced the fifth-lowest real GDP growth rate. In March 2024, Rivian paused plans to build a $5 billion EV factory in Georgia, which was set to be one of the biggest economic development initiatives in the state in history.
These delays are likely to exacerbate setbacks for the state, however, both Kia and Hyundai have made significant investments in the EV industry, which could help boost Georgia’s manufacturing sector looking ahead.

-

 Personal Finance1 week ago
Visualizing the Tax Burden of Every U.S. State
-

 Misc6 days ago
Visualized: Aircraft Carriers by Country
-

 Culture6 days ago
How Popular Snack Brand Logos Have Changed
-

 Mining1 week ago
Visualizing Copper Production by Country in 2023
-

 Misc1 week ago
Charted: How Americans Feel About Federal Government Agencies
-

 Healthcare1 week ago
Which Countries Have the Highest Infant Mortality Rates?
-

 Demographics1 week ago
Mapped: U.S. Immigrants by Region
-

 Maps1 week ago
Mapped: Southeast Asia’s GDP Per Capita, by Country