Globalization
The Top 10 Biggest Companies in Russia
The Top 10 Biggest Companies in Russia
From 1922–1991, the Soviet Union (USSR) was not only the world’s largest country, but also one of its most populated, influential, and powerful.
Today, modern Russia still holds all of those distinctions. Though no longer a designated superpower, the Russian Federation has recovered from the fall of the Soviet Union and has become the world’s 11th-largest economy.
Even after being expelled from the G7 over its annexation of Crimea, Russia’s membership as one of the principal emerging economies in BRICS (alongside Brazil, India, China, and South Africa), the G20, and the United Nations Security Council solidifies its important position in the modern world.
What industries and companies drive the modern Russian state? Here we put the spotlight on the top 10 biggest companies in Russia, using data from Companies Market Cap.
What Are the Biggest Public Companies in Russia?
As a resource-rich country and previously a socialist state, it’s no surprise that many of Russia’s biggest companies are current or former state-owned corporations.
Eight out of the biggest companies in Russia by market value are in natural resources, and four are current state-owned enterprises.
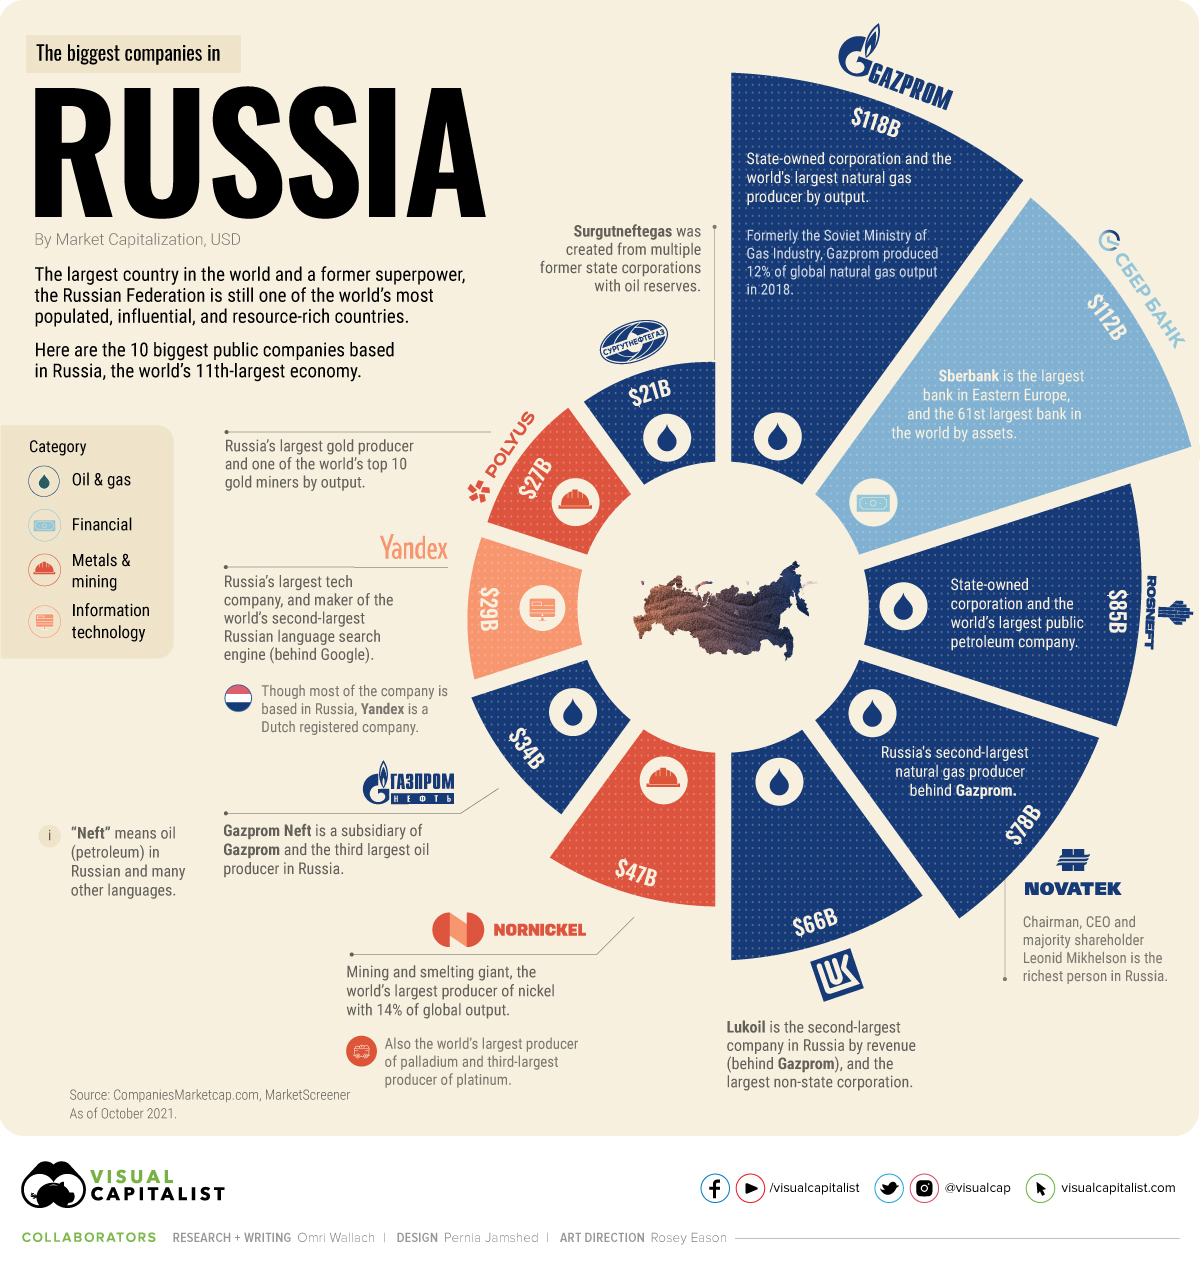
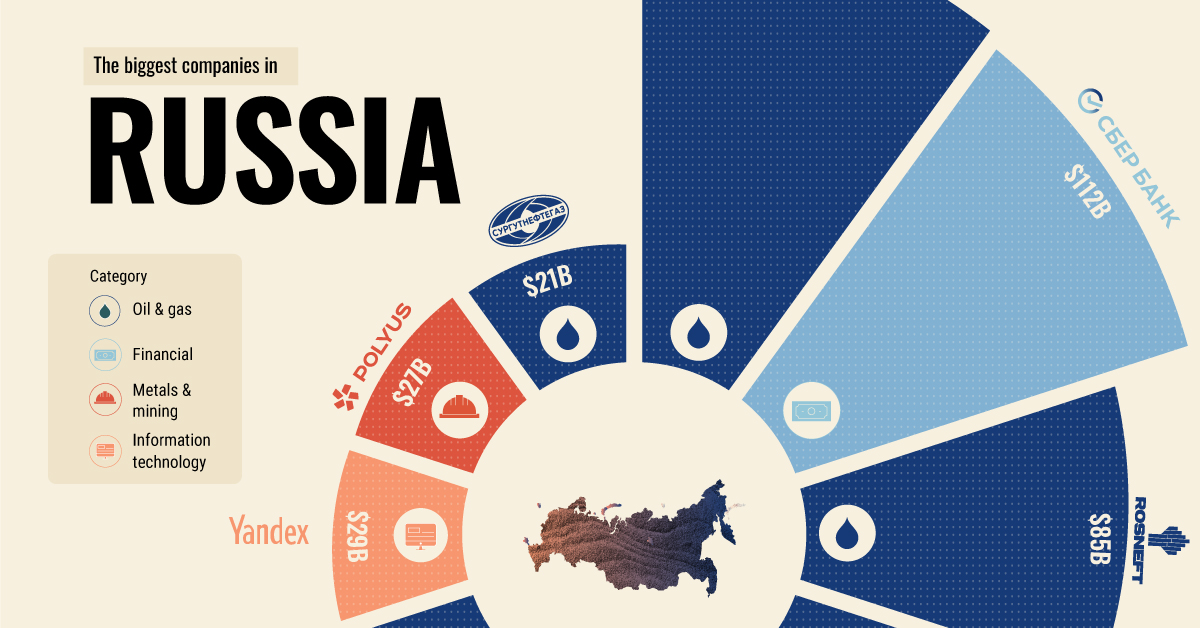
Here are Russia’s biggest public companies by market capitalization in November 2021:
| Top 10 Russian Companies | Category | Market Cap (USD) |
|---|---|---|
| Gazprom | Oil and Gas | $118B |
| Sberbank | Financial | $112B |
| Rosneft | Oil and Gas | $85B |
| Novatek | Oil and Gas | $78B |
| Lukoil | Oil and Gas | $66B |
| Nornickel | Metals & Mining | $47B |
| Gazprom Neft | Oil and Gas | $34B |
| Yandex | Information Technology | $29B |
| Polyus | Metals & Mining | $27B |
| Surgutneftegas | Oil and Gas | $21B |
The two biggest companies in Russia, gas producer Gazprom (formerly the Soviet Ministry of Gas Industry) and banking and financial provider Sberbank, have consistently been the largest enterprises in the country.
In November, Gazprom was bigger with a market cap of $118 billion compared to Sberbank’s $112 billion, though they constantly switch places over time.
But other than Sberbank and tech provider Yandex, the top 10 was composed entirely of oil, gas and mining companies.
Russia’s Importance to Global Natural Resources
Oil and gas specifically made up six out of the 10 biggest companies in Russia. Most like Rosneft, Gazprom Neft, and Lukoil are in oil—the Russian word “neft” means oil or petroleum in Russian and many other languages).
In addition to the two mining companies that cracked the top 10, the biggest companies in Russia highlight the country’s relative importance to global resource sectors. Many of the top 10 companies in Russia are the largest (or amongst the largest) producers of natural resources in the world:
- Gazprom: The largest natural gas company in the world by output, producing 12% of global natural gas output in 2018.
- Rosneft: The world’s largest public oil producer.
- Nornickel: The world’s largest producer of nickel (14% of global output), palladium, and third-largest of platinum.
- Polyus: The world’s third-largest gold producer by output.
- Sberbank: The largest bank in Eastern Europe (and 61st in the world).
Overall, Russia’s vast landscape is estimated to contain over 30% of all natural resources in the world. Factor in a powerful financial sector and the world’s sixth-largest labor force at 70 million strong, and it’s clear to see why the country’s influence is so widespread.
As global powers begin to pledge greater commitment to clean energy, however, Russian companies also find themselves navigating transitional demand and pledging support for green projects.
What other companies or industries do you associate with Russia?


Maps
Mapped: The Top Exports in Asian Countries
Asia’s exports span a wide range, from petroleum to technology components and textile products.
The Top Exports in Asian Countries
This was originally posted on our Voronoi app. Download the app for free on iOS or Android and discover incredible data-driven charts from a variety of trusted sources.
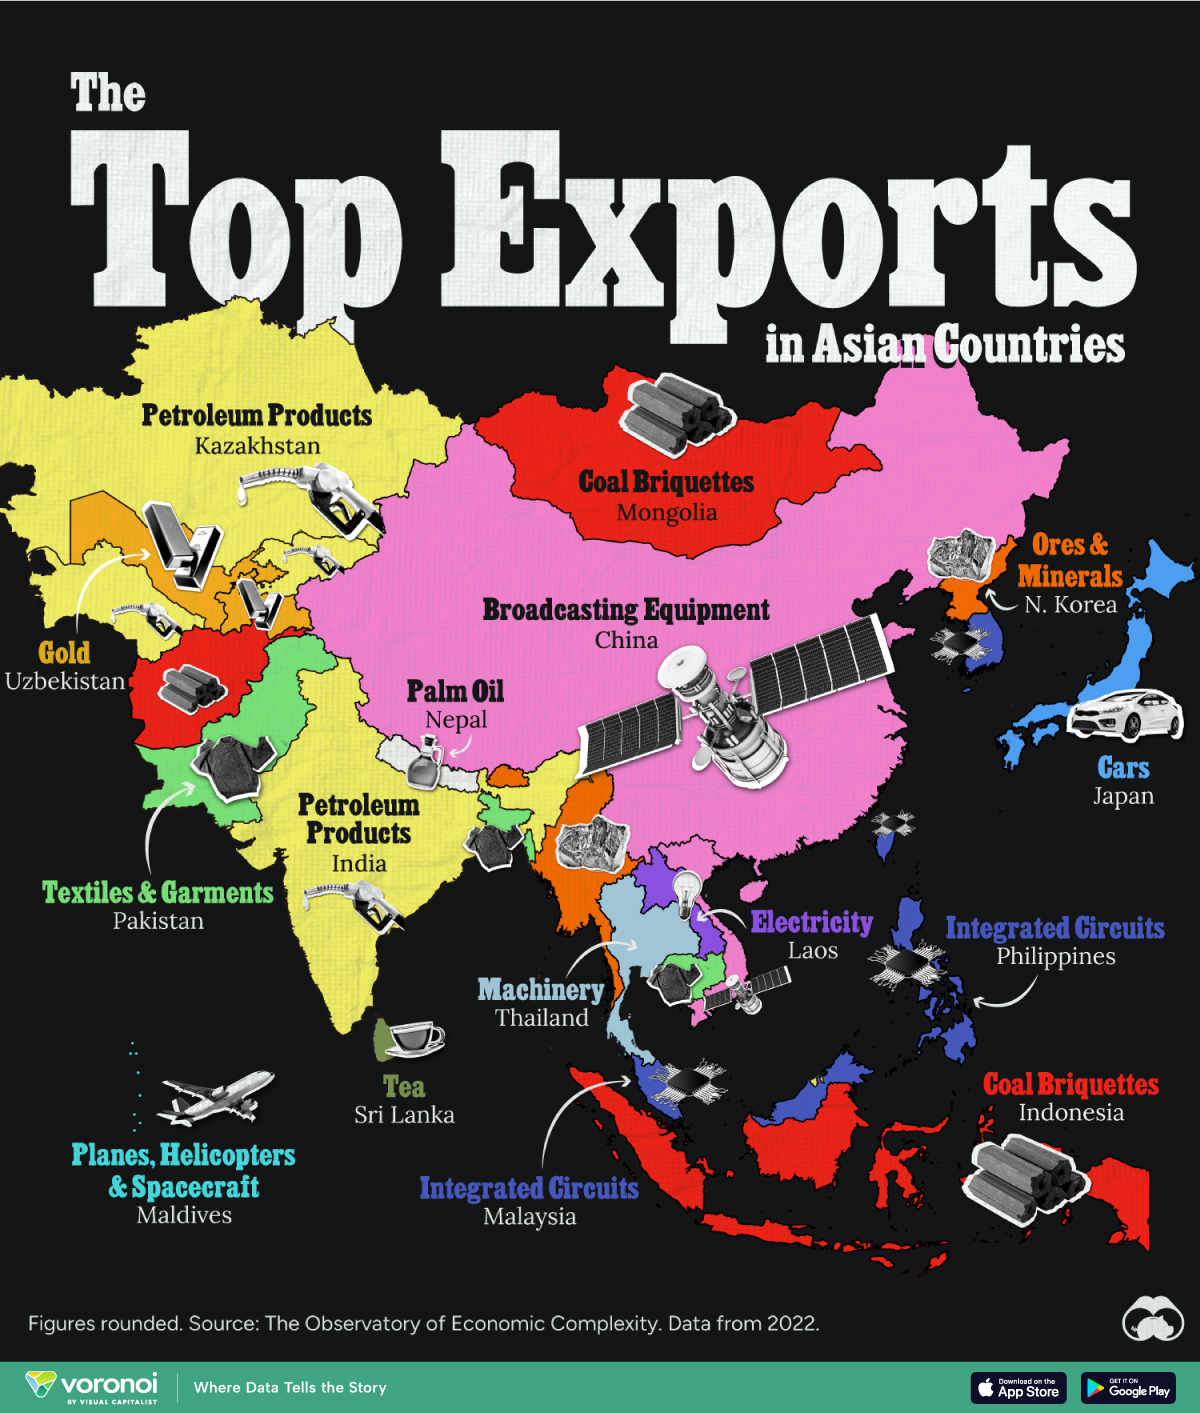
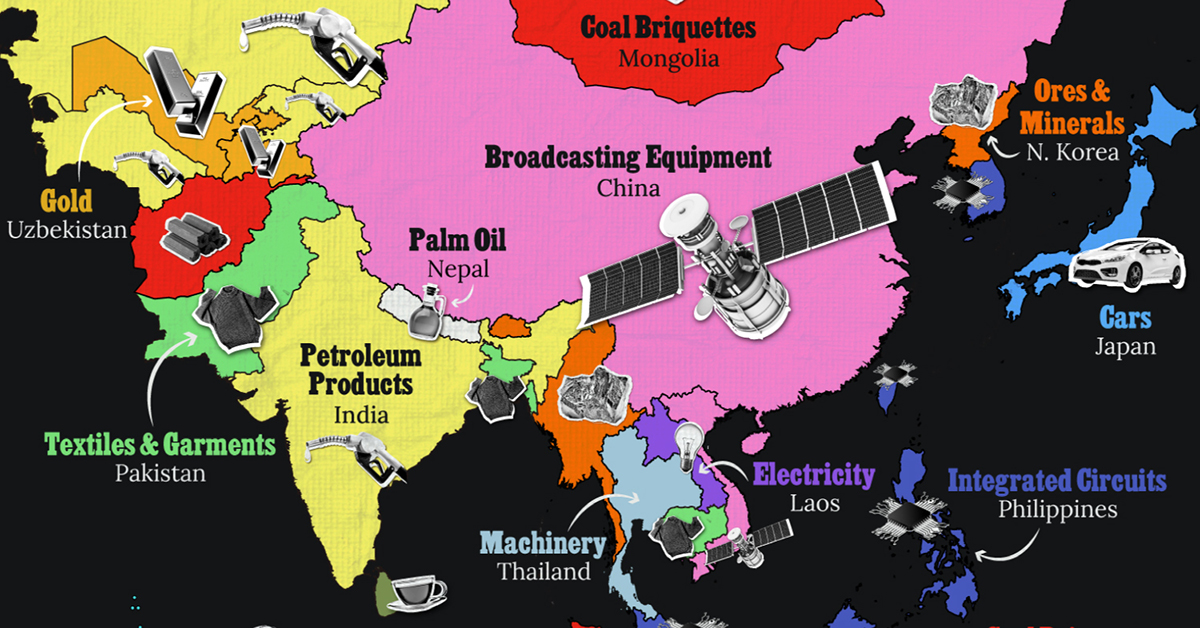
Asia’s exports span a wide range, from petroleum and minerals to technology components and textile products.
In this map, we display the top exports (as of 2022) of Asian countries, excluding Middle Eastern nations. Data was sourced from The Observatory of Economic Complexity.
Editor’s Note: For our most recent Middle East themed version of this map, go here.
Diverse Economies Across the Continent
Like in many other countries around the world, petroleum is a significant component of the Asian continental economy, with petroleum products as India’s top exporting category, amounting to approximately $86 billion per year in trade.
Another top product coming from Asia is integrated circuits. These are used in a multitude of applications spanning computing, communications, consumer electronics, automotive, industrial automation, medical devices, aerospace and defense.
| Country | Top Export (2022) | Top Export Value (USD Billions) |
|---|---|---|
| 🇨🇳 China | Broadcasting Equipment | $272.0 |
| 🇹🇼 Taiwan | Integrated Circuits | $223.0 |
| 🇰🇷 South Korea | Integrated Circuits | $121.0 |
| 🇯🇵 Japan | Cars | $89.0 |
| 🇮🇳 India | Petroleum Products | $86.2 |
| 🇸🇬 Singapore | Integrated Circuits | $81.9 |
| 🇲🇾 Malaysia | Integrated Circuits | $78.9 |
| 🇻🇳 Vietnam | Broadcasting Equipment | $58.5 |
| 🇮🇩 Indonesia | Coal Briquettes | $50.8 |
| 🇰🇿 Kazakhstan | Petroleum Products | $47.6 |
| 🇵🇭 Philippines | Integrated Circuits | $32.4 |
| 🇦🇿 Azerbaijan | Petroleum Products | $19.4 |
| 🇹🇭 Thailand | Machinery | $19.3 |
| 🇹🇲 Turkmenistan | Petroleum Products | $9.2 |
| 🇧🇩 Bangladesh | Textiles and Garments | $9.1 |
| 🇲🇳 Mongolia | Coal Briquettes | $6.5 |
| 🇺🇿 Uzbekistan | Gold | $5.2 |
| 🇧🇳 Brunei | Petroleum Products | $4.9 |
| 🇵🇰 Pakistan | Textiles and Garments | $4.9 |
| 🇲🇲 Myanmar (Burma) | Ore & Minerals | $4.1 |
| 🇰🇭 Cambodia | Textiles and Garments | $3.1 |
| 🇱🇦 Laos | Electricity | $2.4 |
| 🇱🇰 Sri Lanka | Tea | $1.3 |
| 🇬🇪 Georgia | Ore & Minerals | $1.0 |
| 🇦🇲 Armenia | Ore & Minerals | $0.7 |
| 🇹🇯 Tajikistan | Gold | $0.6 |
| 🇦🇫 Afghanistan | Coal Briquettes | $0.4 |
| 🇲🇻 Maldives | Planes, Helicopters, Spacecraft | $0.4 |
| 🇧🇹 Bhutan | Ore & Minerals | $0.3 |
| 🇹🇱 Timor-Leste (East Timor) | Petroleum Products | $0.3 |
| 🇳🇵 Nepal | Palm Oil | $0.2 |
| 🇰🇬 Kyrgyzstan | Petroleum Products | $0.1 |
| 🇰🇵 North Korea | Ore & Minerals | $0.03 |
In addition, the region is also a big manufacturer of semiconductors, crucial for applications ranging from telecommunications and artificial intelligence to renewable energy and healthcare. Taiwan holds a 68% share of the advanced semiconductor market.
Pakistan, Bangladesh, and Cambodia are major producers of textile products such as t-shirts, sweaters, and household linens. Most of their products go to the United States and Europe, feeding popular outfit brands.
Asia stands out as a top producer of minerals and fuel, with Afghanistan, Indonesia, and Mongolia being top producers of coal briquettes used for heating, cooking, and industrial processes, while Armenia, Georgia, Bhutan, Myanmar (Burma), and North Korea rely on ore and mineral extraction as their top exporting sector.
The largest Asian economy, China, is known for the production of a variety of products, but its top exports come from broadcasting equipment, including TVs, cameras, and radios.

-

 Technology1 week ago
Countries With the Highest Rates of Crypto Ownership
-

 Mining6 days ago
Visualizing Copper Production by Country in 2023
-

 Politics7 days ago
Charted: How Americans Feel About Federal Government Agencies
-

 Healthcare1 week ago
Which Countries Have the Highest Infant Mortality Rates?
-

 Demographics1 week ago
Mapped: U.S. Immigrants by Region
-

 Economy1 week ago
Mapped: Southeast Asia’s GDP Per Capita, by Country
-

 Automotive1 week ago
How People Get Around in America, Europe, and Asia
-

 Personal Finance1 week ago
Visualizing the Tax Burden of Every U.S. State