Automotive
Putting EV Valuations Into Perspective


Putting EV Valuations Into Perspective
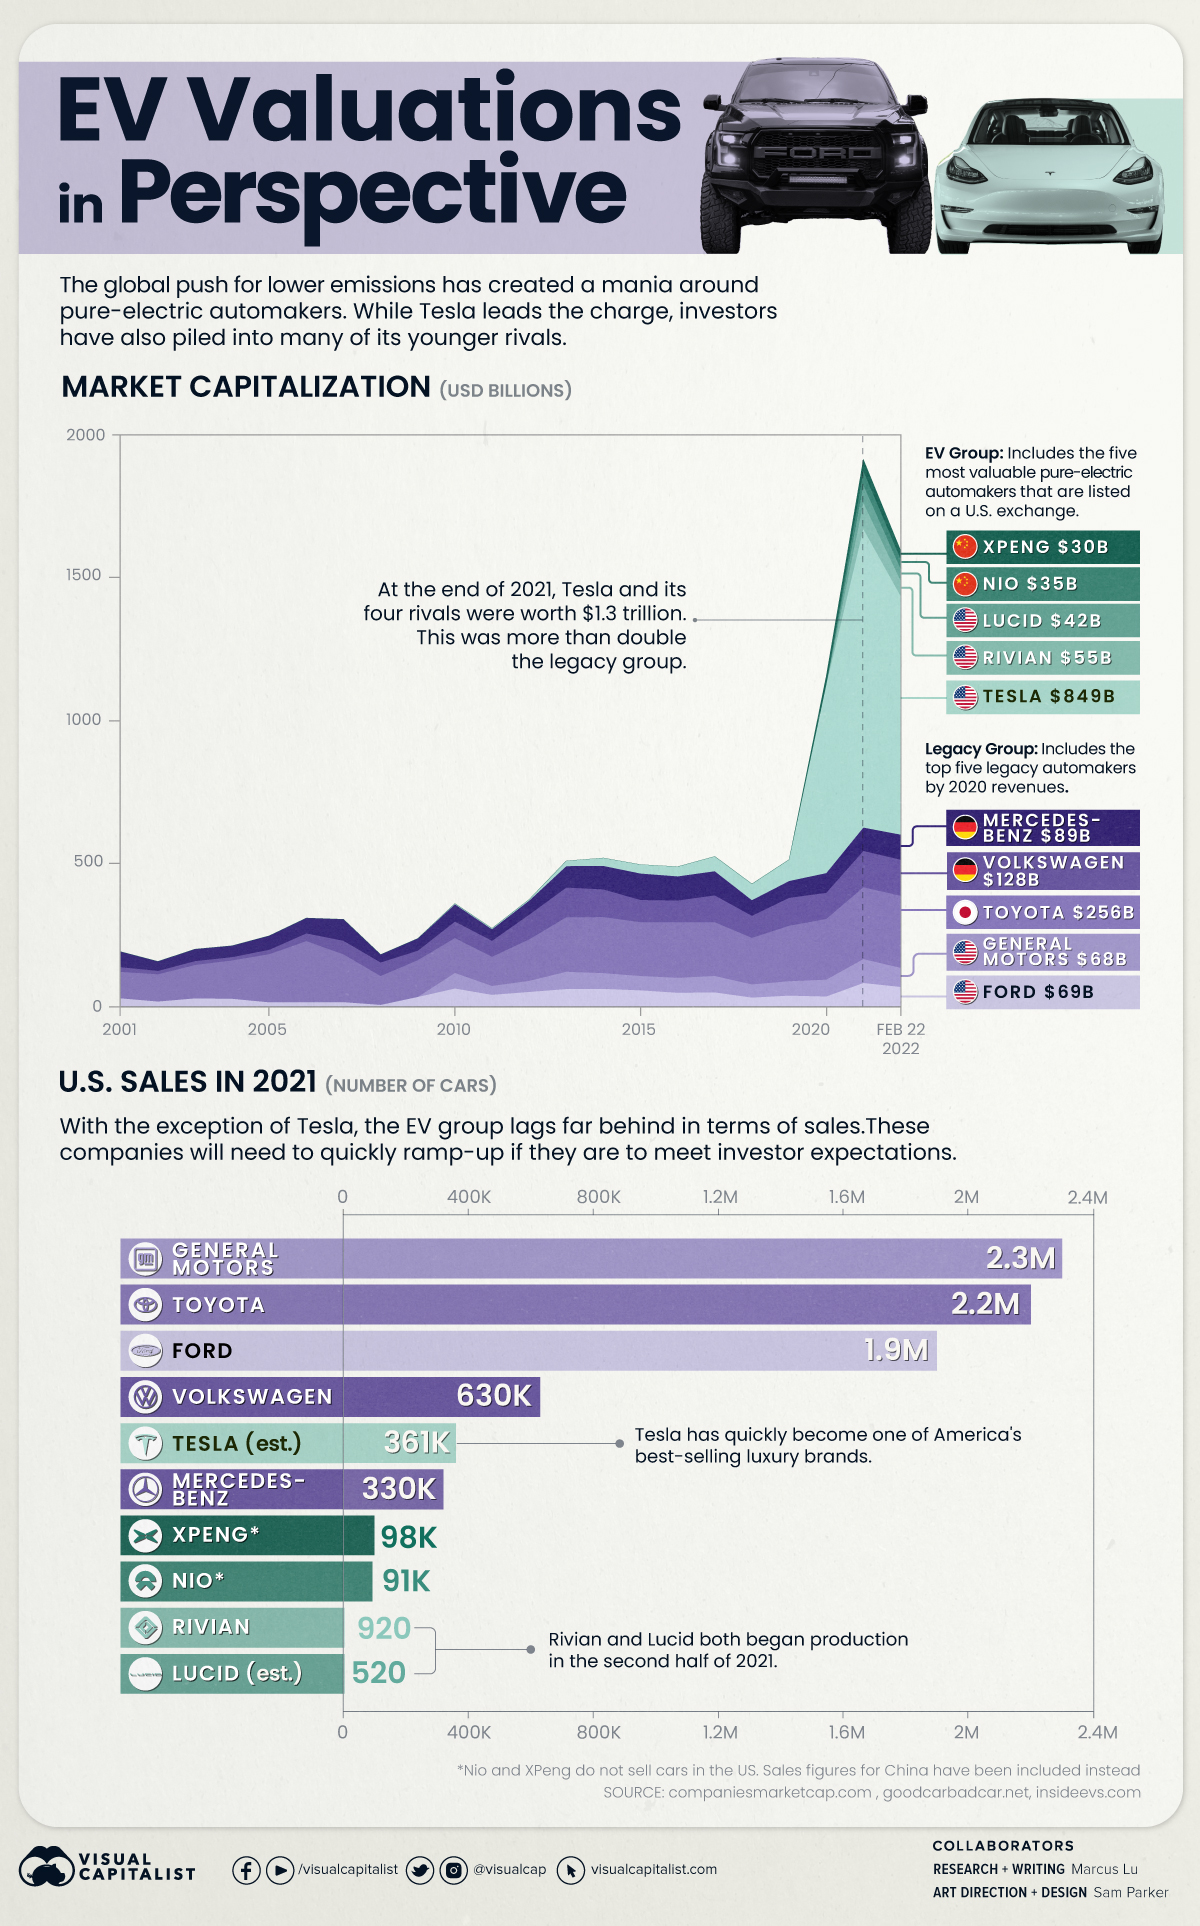
The global push for lower emissions has created a mania around pure-electric automakers. While Tesla leads the charge, institutional investors have also piled into many of its younger rivals.
For example, in 2019, Saudi Arabia’s sovereign wealth fund invested $1.3 billion into Lucid Motors. One year later, it was revealed that Amazon had a 20% stake (worth $3.8B) in Rivian.
To see how quickly EV valuations have ballooned, we’ve visualized the historical market capitalizations (market caps) of 10 prominent automakers.
Legacy vs Pure-Electric
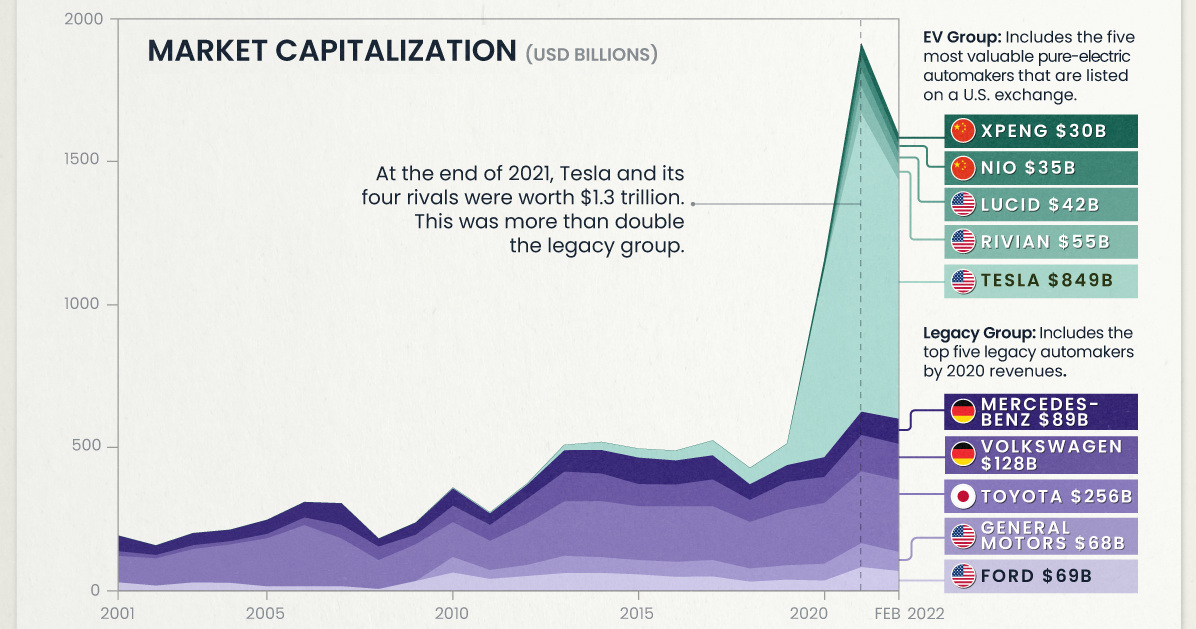
The legacy group includes five top traditional automakers, while the EV group includes the five most valuable pure-electric automakers that are listed on an American exchange.
The following table lists the market caps of these companies at various dates. While XPeng and NIO are listed on the New York Stock Exchange, they do not currently sell cars in the U.S.
| Automaker | Type | 2010 | 2015 | 2021 | 02/22/2022 |
|---|---|---|---|---|---|
| 🇺🇸 Tesla | EV | $3B | $31B | $1,061B | $849B |
| 🇯🇵 Toyota | Legacy | $124B | $191B | $255B | $256B |
| 🇩🇪 Volkswagen Group | Legacy | $59B | $79B | $129B | $128B |
| 🇩🇪 Mercedes-Benz | Legacy | $61B | $94B | $83B | $89B |
| 🇺🇸 Ford | Legacy | $63B | $57B | $83B | $69B |
| 🇺🇸 General Motors | Legacy | $55B | $51B | $85B | $68B |
| 🇺🇸 Rivian | EV | N/A | N/A | $93B | $55B |
| 🇺🇸 Lucid | EV | N/A | N/A | $63B | $42B |
| 🇨🇳 NIO | EV | N/A | N/A | $50B | $35B |
| 🇨🇳 Xpeng | EV | N/A | N/A | $41B | $30B |
Source: Companies Market Cap
At the end of 2021, Tesla and its four EV rivals were worth a combined $1.3 trillion. This was more than double of the legacy group, which was worth $635 billion. EV valuations have cooled since then, though Tesla is still the world’s most valuable automaker by a significant margin.
U.S. Sales in 2021
Comparing U.S. sales gives an interesting perspective on these companies’ relative scale. Once again, note that XPeng and NIO do not sell cars in America. We’ve provided figures for their home market (China) instead.
| Automaker | U.S. Sales in 2021 |
|---|---|
| General Motors | 2.3 million |
| Toyota | 2.2 million |
| Ford | 1.9 million |
| Volkswagen Group | 630,000 |
| Tesla | 361,000 (est.) |
| Mercedes-Benz | 330,000 |
| XPeng | 98,000 (China) |
| NIO | 91,000 (China) |
| Rivian | 920 |
| Lucid | 520 (est.) |
Source: Good Car Bad Car
Impressively, Tesla has overtaken Mercedes in the U.S. to become one of the country’s top luxury brands.
The Long Road Ahead
To satisfy investor expectations, Rivian and Lucid will need to rapidly scale their production and sales. Failing to do so could lead to significant stock price volatility.
Investors should also note that both companies could experience similar challenges as Tesla, which Musk has referred to as “production hell”. Rivian has already pushed back deliveries of its first SUV, while Lucid customers have been notified of delays due to “fit and finish” issues.
Nevertheless, these young manufacturers are setting some serious goals. Rivian aims to produce one million cars annually by the year 2030, while Lucid is targeting a more conservative 49,000 cars in 2023.
Tesla Goes on the Defensive
Tesla is still the undisputed EV leader, but competition is rapidly heating up.
On one hand, legacy automakers have been investing heavily in EV development, and new models are coming en masse. The Volkswagen Group is the biggest threat, selling 453,000 EVs globally in 2021 (up 96% over 2020). For reference, Tesla reported global sales of 936,000 in 2021.
On the other hand, Tesla must also defend its market share from an onslaught of Chinese entrants. This includes XPeng and NIO, which appear to be on similar trajectories. Both firms were founded in 2014, both sold nearly 100,000 EVs in 2021, and both have recently expanded into European markets. A U.S. expansion also seems to be imminent.
With the entire auto industry moving towards battery powered vehicles, will the market rethink its valuation of Tesla?


Automotive
How People Get Around in America, Europe, and Asia
Examining how people get around using cars, public transit, and walking or biking, and the regional differences in usage.


How People Get Around in America, Europe, and Asia
This was originally posted on our Voronoi app. Download the app for free on iOS or Android and discover incredible data-driven charts from a variety of trusted sources.
This chart highlights the popularity of different transportation types in the Americas, Europe, and Asia, calculated by modal share.
Data for this article and visualization is sourced from ‘The ABC of Mobility’, a research paper by Rafael Prieto-Curiel (Complexity Science Hub) and Juan P. Ospina (EAFIT University), accessed through ScienceDirect.
The authors gathered their modal share data through travel surveys, which focused on the primary mode of transportation a person employs for each weekday trip. Information from 800 cities across 61 countries was collected for this study.
North American Car Culture Contrasts with the Rest of the World
In the U.S. and Canada, people heavily rely on cars to get around, no matter the size of the city. There are a few exceptions of course, such as New York, Toronto, and smaller college towns across the United States.
| Region | 🚗 Cars | 🚌 Public Transport | 🚶 Walking/Biking |
|---|---|---|---|
| North America* | 92% | 5% | 4% |
| Central America | 23% | 42% | 35% |
| South America | 29% | 40% | 31% |
| Northern Europe | 48% | 29% | 24% |
| Western Europe | 43% | 24% | 34% |
| Southern Europe | 50% | 24% | 25% |
| Eastern Europe | 35% | 40% | 25% |
| Southeastern Asia | 44% | 43% | 13% |
| Western Asia | 43% | 28% | 29% |
| Southern Asia | 22% | 39% | 39% |
| Eastern Asia | 19% | 46% | 35% |
| World | 51% | 26% | 22% |
Note: *Excluding Mexico. Percentages are rounded.
As a result, North America’s share of public transport and active mobility (walking and biking) is the lowest amongst all surveyed regions by a significant amount.
On the other hand, public transport reigns supreme in South and Central America as well as Southern and Eastern Asia. It ties with cars in Southeastern Asia, and is eclipsed by cars in Western Asia.
As outlined in the paper, Europe sees more city-level differences in transport popularity.
For example, Utrecht, Netherlands prefers walking and biking. People in Paris and London like using their extensive transit systems. And in Manchester and Rome, roughly two out of three journeys are by car.

-

 United States1 week ago
Mapped: Countries Where Recreational Cannabis is Legal
-

 Healthcare2 weeks ago
Life Expectancy by Region (1950-2050F)
-

 Markets2 weeks ago
The Growth of a $1,000 Equity Investment, by Stock Market
-

 Markets2 weeks ago
Mapped: Europe’s GDP Per Capita, by Country
-

 Money2 weeks ago
Charted: What Frustrates Americans About the Tax System
-

 Technology2 weeks ago
Countries With the Highest Rates of Crypto Ownership
-

 Mining2 weeks ago
Where the World’s Aluminum is Smelted, by Country
-

 Personal Finance2 weeks ago
Visualizing the Tax Burden of Every U.S. State