Mapped: The 10 U.S. States With the Lowest Real GDP Growth
Ranked: The World’s 50 Largest Private Equity Firms
Top 10 Countries Most in Debt to the IMF
Ranked: The Top 6 Economies by Share of Global GDP (1980-2024)
Mapped: Europe’s GDP Per Capita, by Country
Countries With the Highest Rates of Crypto Ownership
Mapped: The Number of AI Startups By Country
All of the Grants Given by the U.S. CHIPS Act
Visualizing AI Patents by Country
How Tech Logos Have Evolved Over Time
Visualizing America’s Average Retirement Savings, by Age
Visualizing the Tax Burden of Every U.S. State
Charted: What Frustrates Americans About the Tax System
Ranked: The Top 20 Countries in Debt to China
Mapped: Countries Where Recreational Cannabis is Legal
Which Countries Have the Highest Infant Mortality Rates?
Life Expectancy by Region (1950-2050F)
What Causes Preventable Child Deaths?
The Cost of an EpiPen in Major Markets
Who’s Building the Most Solar Energy?
Mapped: The Age of Energy Projects in Interconnection Queues, by State
Ranked: The Top 10 EV Battery Manufacturers in 2023
The World’s Biggest Nuclear Energy Producers
The World’s Biggest Oil Producers in 2023
Mapped: The Top Exports in Asian Countries
Mapped: U.S. States By Number of Cities Over 250,000 Residents
Mapped: U.S. Immigrants by Region
The Biggest Salt Producing Countries in 2023
Visualizing Copper Production by Country in 2023
Where the World’s Aluminum is Smelted, by Country
Visualizing Global Gold Production in 2023
How People Get Around in America, Europe, and Asia
The Carbon Footprint of Major Travel Methods
Ranking the Top 15 Countries by Carbon Tax Revenue
Ranked: The Countries With the Most Air Pollution in 2023
Top Countries By Forest Growth Since 2001
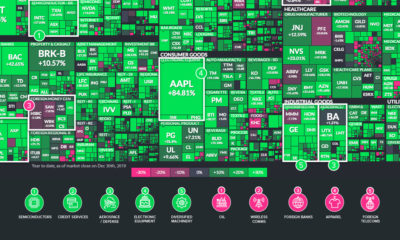
The U.S. stock market had a banner year, but some sectors were notable outliers. Here are the ones that outperformed (and underperformed) in 2019.
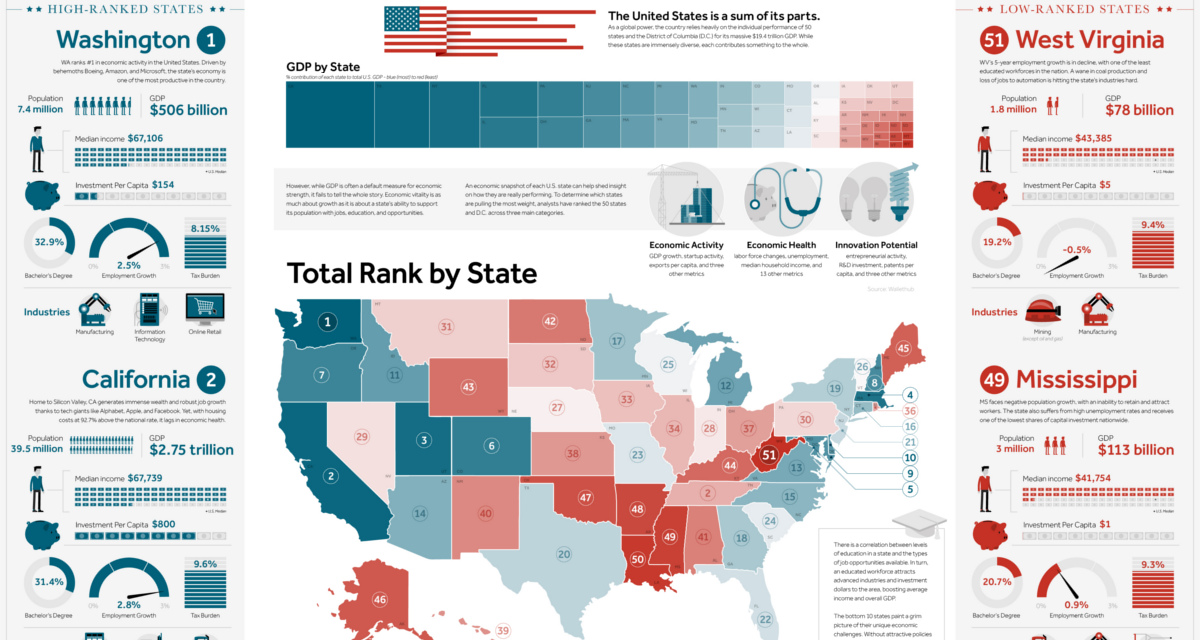
This giant infographic has state economies ranked from best to worst, based on an overall score comprised of 27 different metrics.
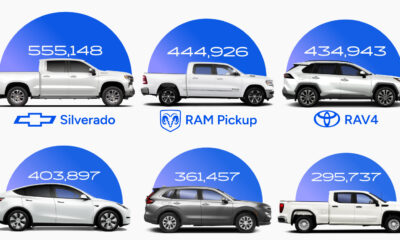
In 2023, nine of the top 10 best-selling vehicles in America were trucks or SUVs. This graphic shows the most popular vehicles overall.
Considering factors like the cost of investment and number of locations, this graphic breaks down the best franchises in the U.S.
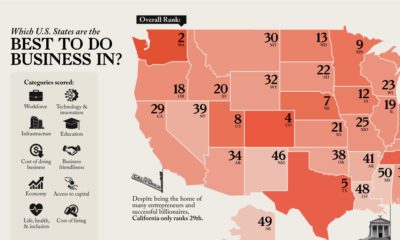
Looking to start a business? This map reveals America's best states to do business in, analyzing everything from workforce to infrastructure.
A collection of the best Warren Buffett quotes, accompanied with illustrations, to close out our infographic series on the famous investor.
We round up the most popular, most discussed, and most liked visualizations of the month on Voronoi, our new data storytelling platform.
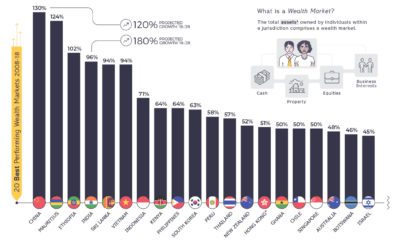
This telling chart shows how national wealth markets have changed over the past decade, highlighting the biggest winners and losers.
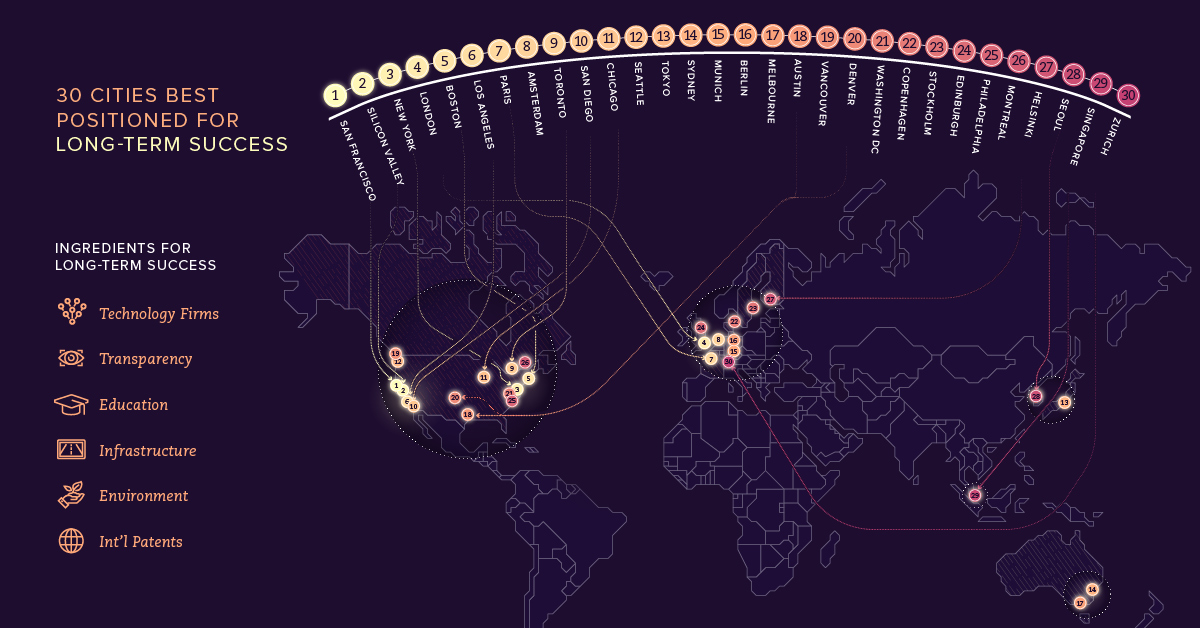
Which cities will be able to attract top-end talent and foster future innovation in order to stay atop a changing and increasingly digital global economy?
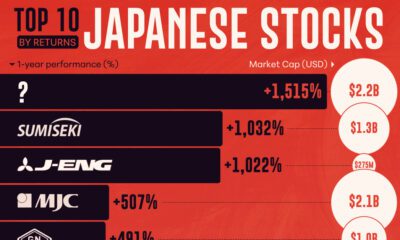
With the Nikkei 225 hitting its first all-time high since 1989, we've ranked the top 10 Japanese stocks by their 1-yr return.