Mapped: The 10 U.S. States With the Lowest Real GDP Growth
Ranked: The World’s 50 Largest Private Equity Firms
Top 10 Countries Most in Debt to the IMF
Ranked: The Top 6 Economies by Share of Global GDP (1980-2024)
Mapped: Europe’s GDP Per Capita, by Country
Countries With the Highest Rates of Crypto Ownership
Mapped: The Number of AI Startups By Country
All of the Grants Given by the U.S. CHIPS Act
Visualizing AI Patents by Country
How Tech Logos Have Evolved Over Time
Visualizing America’s Average Retirement Savings, by Age
Visualizing the Tax Burden of Every U.S. State
Charted: What Frustrates Americans About the Tax System
Ranked: The Top 20 Countries in Debt to China
Mapped: Countries Where Recreational Cannabis is Legal
Which Countries Have the Highest Infant Mortality Rates?
Life Expectancy by Region (1950-2050F)
What Causes Preventable Child Deaths?
The Cost of an EpiPen in Major Markets
Who’s Building the Most Solar Energy?
Mapped: The Age of Energy Projects in Interconnection Queues, by State
Ranked: The Top 10 EV Battery Manufacturers in 2023
The World’s Biggest Nuclear Energy Producers
The World’s Biggest Oil Producers in 2023
Mapped: The Top Exports in Asian Countries
Mapped: U.S. States By Number of Cities Over 250,000 Residents
Mapped: U.S. Immigrants by Region
The Biggest Salt Producing Countries in 2023
Visualizing Copper Production by Country in 2023
Where the World’s Aluminum is Smelted, by Country
Visualizing Global Gold Production in 2023
How People Get Around in America, Europe, and Asia
The Carbon Footprint of Major Travel Methods
Ranking the Top 15 Countries by Carbon Tax Revenue
Ranked: The Countries With the Most Air Pollution in 2023
Top Countries By Forest Growth Since 2001
Extra, extra read all about it—these 25 popular U.S. newspapers are trending downwards in their daily print circulation year-over-year.
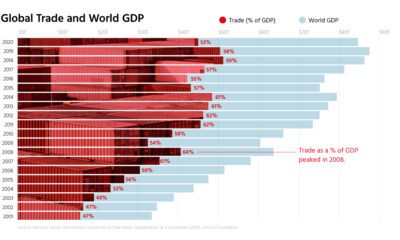
Free trade is a powerful engine for economic growth, but rising protectionism stands in the way. See what the data says in this infographic.
Now, you can explore even more data-driven visualizations from the global talent in our newly launched Creator Program.
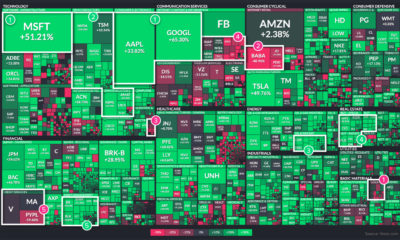
2021 was yet another tumultuous year. Which stock market sectors thrived during the twists and turns of the last 12 months, and which faltered?
The pandemic has put the workforce through the wringer. This year-long survey highlights the four biggest back-to-work priorities and challenges that must be addressed.
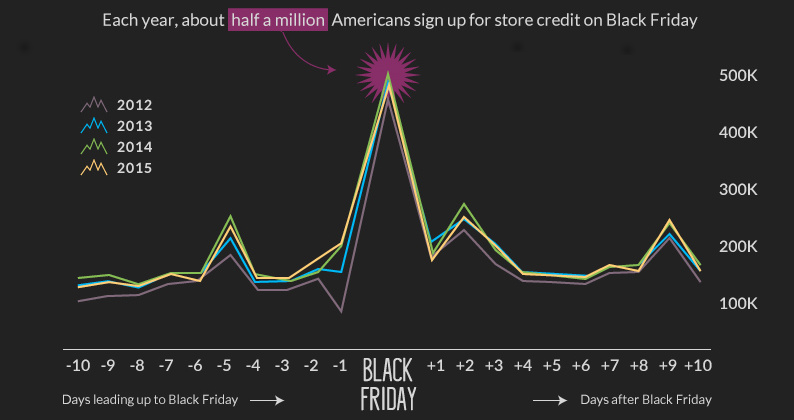
Black Friday kicks off the U.S. holiday shopping season, during which consumers will spend $655.8 billion this year. Where do they get that extra cash from?
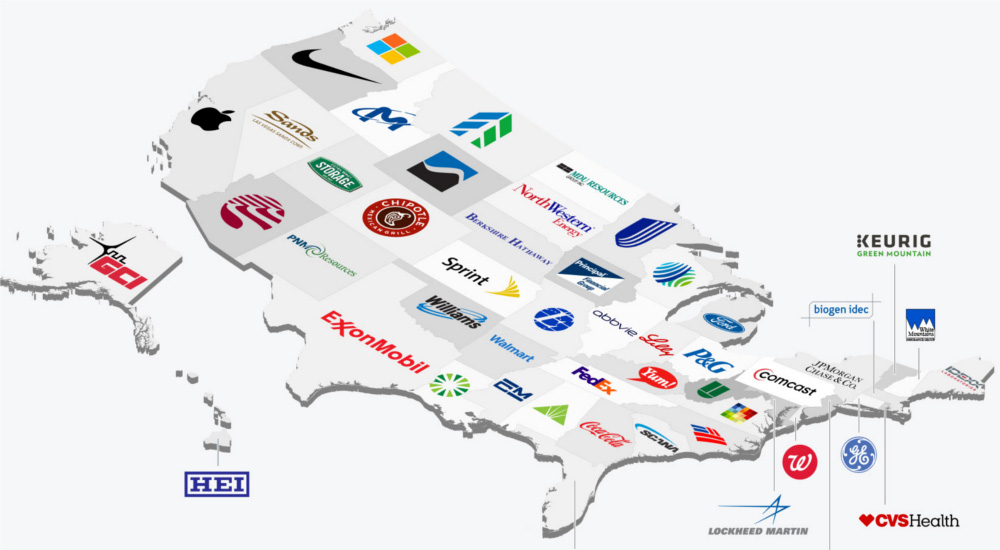
The biggest public company by market capitalization in California is Apple, and it happens to be 4000x the size of the biggest pubco in Wyoming.
U.S. debt interest payments have surged past the $1 trillion dollar mark, amid high interest rates and an ever-expanding debt burden.
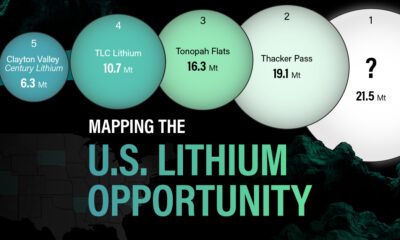
In this graphic, Visual Capitalist partnerered with EnergyX to explore the size and location of U.S. lithium mines.
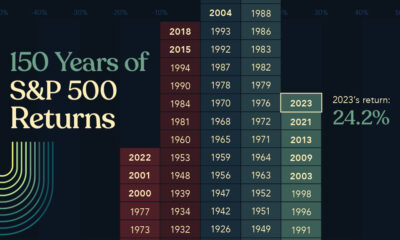
Last year, U.S. stocks took investors by surprise. This graphic shows S&P 500 historical returns since 1875 to put 2023 returns into context.