Mapped: The 10 U.S. States With the Lowest Real GDP Growth
Ranked: The World’s 50 Largest Private Equity Firms
Top 10 Countries Most in Debt to the IMF
Ranked: The Top 6 Economies by Share of Global GDP (1980-2024)
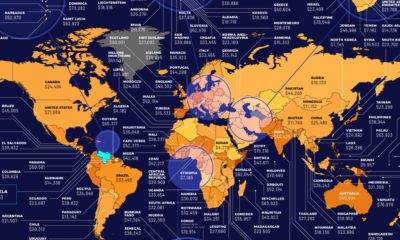
Mapped: Europe’s GDP Per Capita, by Country
Countries With the Highest Rates of Crypto Ownership
Mapped: The Number of AI Startups By Country
All of the Grants Given by the U.S. CHIPS Act
Visualizing AI Patents by Country
How Tech Logos Have Evolved Over Time
Visualizing America’s Average Retirement Savings, by Age
Visualizing the Tax Burden of Every U.S. State
Charted: What Frustrates Americans About the Tax System
Ranked: The Top 20 Countries in Debt to China
Mapped: Countries Where Recreational Cannabis is Legal
Which Countries Have the Highest Infant Mortality Rates?
Life Expectancy by Region (1950-2050F)
What Causes Preventable Child Deaths?
The Cost of an EpiPen in Major Markets
Who’s Building the Most Solar Energy?
Mapped: The Age of Energy Projects in Interconnection Queues, by State
Ranked: The Top 10 EV Battery Manufacturers in 2023
The World’s Biggest Nuclear Energy Producers
The World’s Biggest Oil Producers in 2023
Mapped: The Top Exports in Asian Countries
Mapped: U.S. States By Number of Cities Over 250,000 Residents
Mapped: U.S. Immigrants by Region
The Biggest Salt Producing Countries in 2023
Visualizing Copper Production by Country in 2023
Where the World’s Aluminum is Smelted, by Country
Visualizing Global Gold Production in 2023
How People Get Around in America, Europe, and Asia
The Carbon Footprint of Major Travel Methods
Ranking the Top 15 Countries by Carbon Tax Revenue
Ranked: The Countries With the Most Air Pollution in 2023
Top Countries By Forest Growth Since 2001
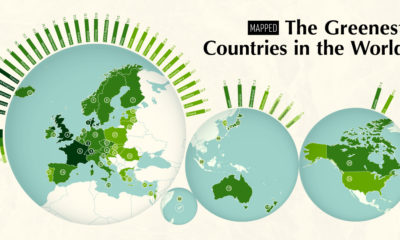
The world's growing focus on sustainability is a clear sign of the times. This map ranks the 40 greenest countries in the world.
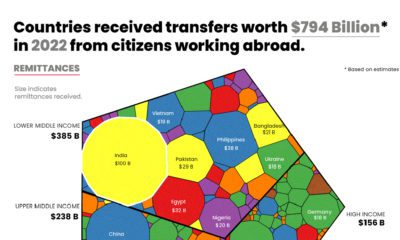
Which countries rely on remittance flows the most? This animation shows the amount of remittance income that countries received in 2022.
The history of Europe is breathtakingly complex, but this animation helps makes sense of 2,400 years of change on the European map.
Mining bitcoin is costly. But the exact price fluctuates, depending on the location and the cost of electricity in the area.
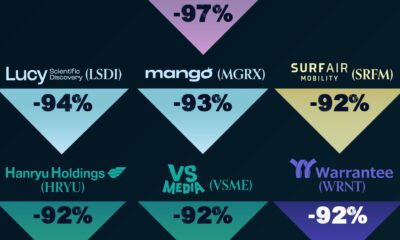
The Chinese EV battery company U Power experienced the worst IPO performance in 2023.
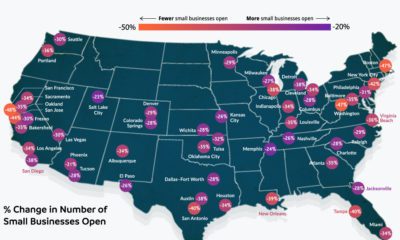
Compared to January 2020, 34% of small businesses are currently closed. This map looks at the small business recovery rate in 50 metro areas.
Antarctica's ice extent has reached record lows. This visual details and maps Antarctica sea ice loss over the last two years.
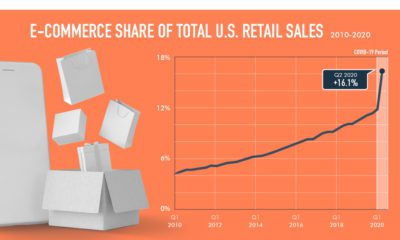
E-commerce is already massive, but COVID-19 has proven to be an unexpected catalyst in driving the use of digital marketplaces.
Will global GDP growth continue to be resilient in 2024? This graphic shows the economic outlook for 191 economies around the world.
This era of data abundance should be propelling humankind forward, but valuable insights are often lost in the noise. Data storytelling holds the key.


 Creator Program