Mapped: The 10 U.S. States With the Lowest Real GDP Growth
Ranked: The World’s 50 Largest Private Equity Firms
Top 10 Countries Most in Debt to the IMF
Ranked: The Top 6 Economies by Share of Global GDP (1980-2024)
Mapped: Europe’s GDP Per Capita, by Country
Countries With the Highest Rates of Crypto Ownership
Mapped: The Number of AI Startups By Country
All of the Grants Given by the U.S. CHIPS Act
Visualizing AI Patents by Country
How Tech Logos Have Evolved Over Time
Visualizing America’s Average Retirement Savings, by Age
Visualizing the Tax Burden of Every U.S. State
Charted: What Frustrates Americans About the Tax System
Ranked: The Top 20 Countries in Debt to China
Mapped: Countries Where Recreational Cannabis is Legal
Which Countries Have the Highest Infant Mortality Rates?
Life Expectancy by Region (1950-2050F)
What Causes Preventable Child Deaths?
The Cost of an EpiPen in Major Markets
Who’s Building the Most Solar Energy?
Mapped: The Age of Energy Projects in Interconnection Queues, by State
Ranked: The Top 10 EV Battery Manufacturers in 2023
The World’s Biggest Nuclear Energy Producers
The World’s Biggest Oil Producers in 2023
Mapped: The Top Exports in Asian Countries
Mapped: U.S. States By Number of Cities Over 250,000 Residents
Mapped: U.S. Immigrants by Region
The Biggest Salt Producing Countries in 2023
Visualizing Copper Production by Country in 2023
Where the World’s Aluminum is Smelted, by Country
Visualizing Global Gold Production in 2023
How People Get Around in America, Europe, and Asia
The Carbon Footprint of Major Travel Methods
Ranking the Top 15 Countries by Carbon Tax Revenue
Ranked: The Countries With the Most Air Pollution in 2023
Top Countries By Forest Growth Since 2001
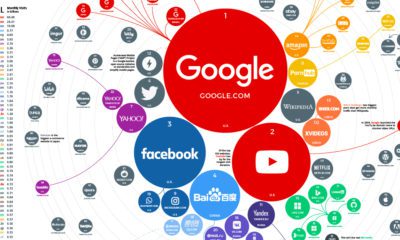
The top 100 websites ranking reveals how people around the world search for information, which services they use, and how they spend time online.
From New York to Damascus, this infographic uses EIU cost of living data to rank the world's most and least expensive cities to live in
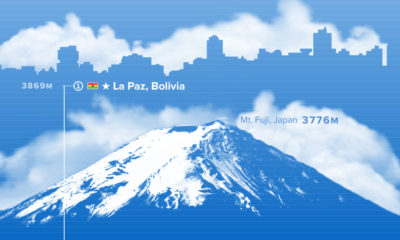
Where are the world’s highest cities? This graphic ranks the world’s major urban centers by altitude above sea level.
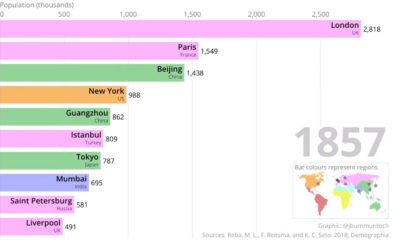
This two-minute animation shows changes in the last 500 years of historical rankings for the world's 10 most populous cities.
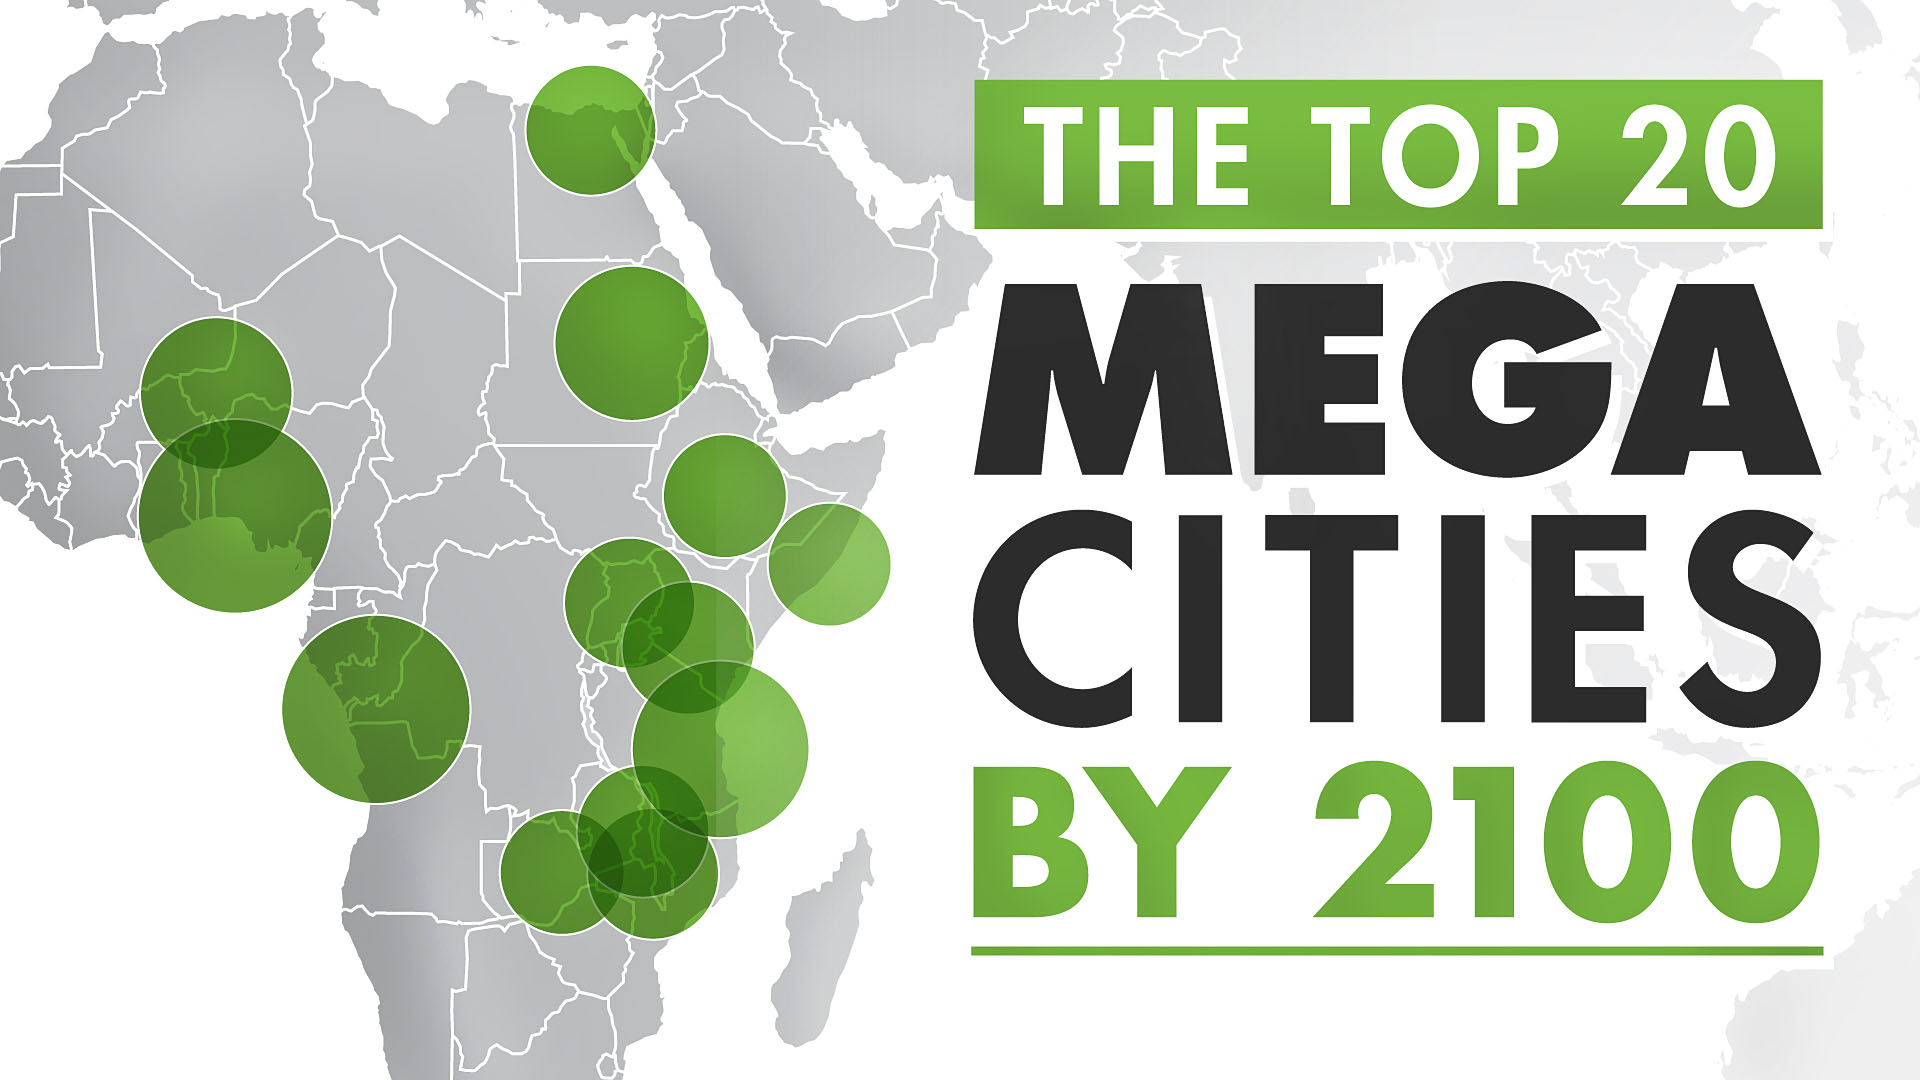
The world's population centers are shifting rapidly, and by 2100, it is projected that the world's largest megacities will exceed 70 million people.
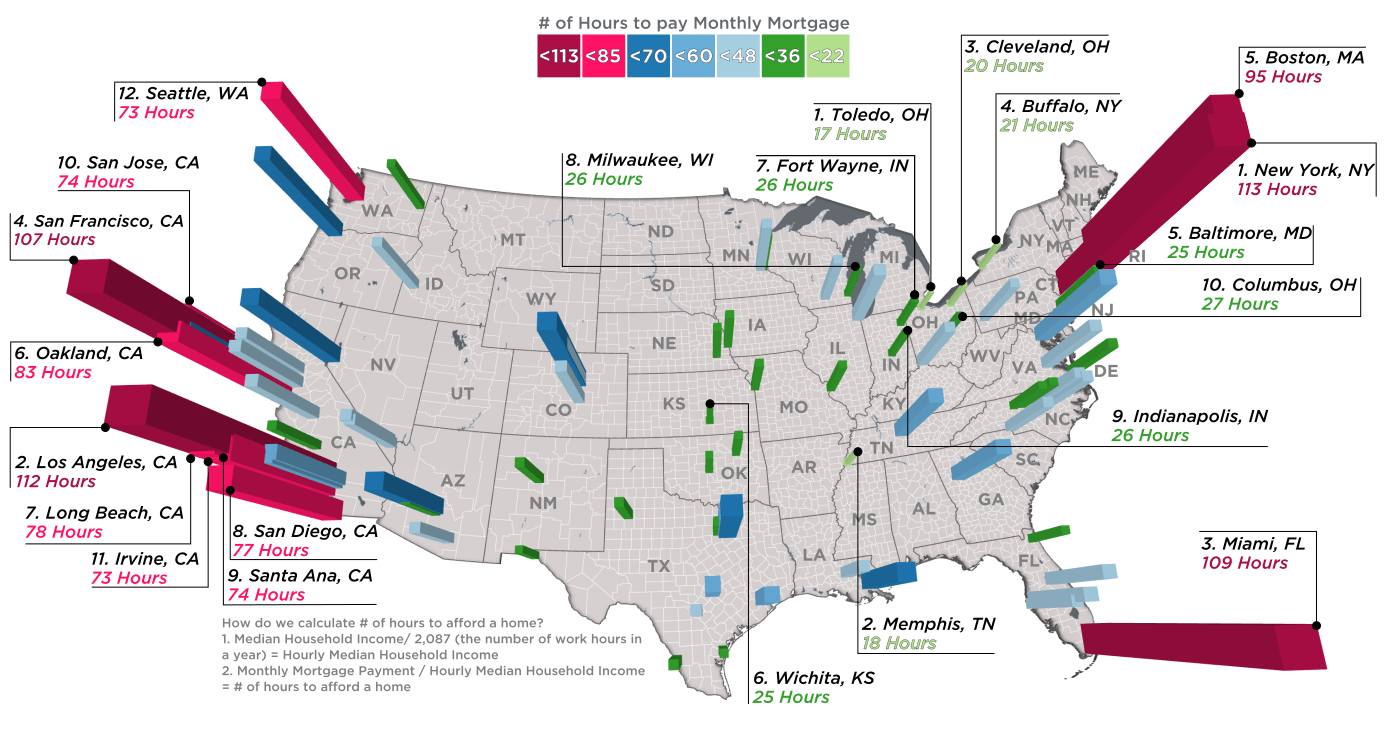
Every month, the average New Yorker needs 113.5 hours of work to pay down a mortgage, while in Memphis it's just 18.4 hours.
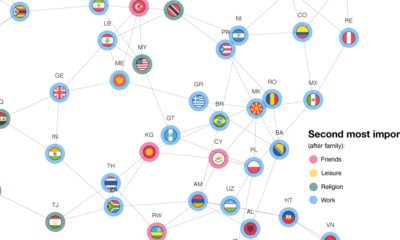
Where you're from greatly influencers how you view the world. Here's a look at the core values in 94 different countries.
How has inflation impacted everyday goods like milk, flour, or fuel? This chart shows the annual change in the price of basic daily goods.
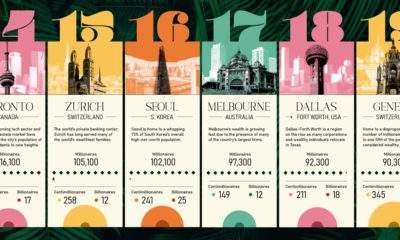
This ranking of the world's wealthiest cities leverages a robust data set that tracks the location and net worth of ultra-wealthy individuals
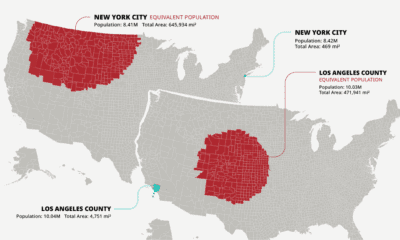
The U.S. population is spread across a huge amount of land, but its distribution is far from equal. These maps are a unique look at population...


 Creator Program