Mapped: The 10 U.S. States With the Lowest Real GDP Growth
Ranked: The World’s 50 Largest Private Equity Firms
Top 10 Countries Most in Debt to the IMF
Ranked: The Top 6 Economies by Share of Global GDP (1980-2024)
Mapped: Europe’s GDP Per Capita, by Country
Countries With the Highest Rates of Crypto Ownership
Mapped: The Number of AI Startups By Country
All of the Grants Given by the U.S. CHIPS Act
Visualizing AI Patents by Country
How Tech Logos Have Evolved Over Time
Visualizing America’s Average Retirement Savings, by Age
Visualizing the Tax Burden of Every U.S. State
Charted: What Frustrates Americans About the Tax System
Ranked: The Top 20 Countries in Debt to China
Mapped: Countries Where Recreational Cannabis is Legal
Which Countries Have the Highest Infant Mortality Rates?
Life Expectancy by Region (1950-2050F)
What Causes Preventable Child Deaths?
The Cost of an EpiPen in Major Markets
Who’s Building the Most Solar Energy?
Mapped: The Age of Energy Projects in Interconnection Queues, by State
Ranked: The Top 10 EV Battery Manufacturers in 2023
The World’s Biggest Nuclear Energy Producers
The World’s Biggest Oil Producers in 2023
Mapped: The Top Exports in Asian Countries
Mapped: U.S. States By Number of Cities Over 250,000 Residents
Mapped: U.S. Immigrants by Region
The Biggest Salt Producing Countries in 2023
Visualizing Copper Production by Country in 2023
Where the World’s Aluminum is Smelted, by Country
Visualizing Global Gold Production in 2023
How People Get Around in America, Europe, and Asia
The Carbon Footprint of Major Travel Methods
Ranking the Top 15 Countries by Carbon Tax Revenue
Ranked: The Countries With the Most Air Pollution in 2023
Top Countries By Forest Growth Since 2001
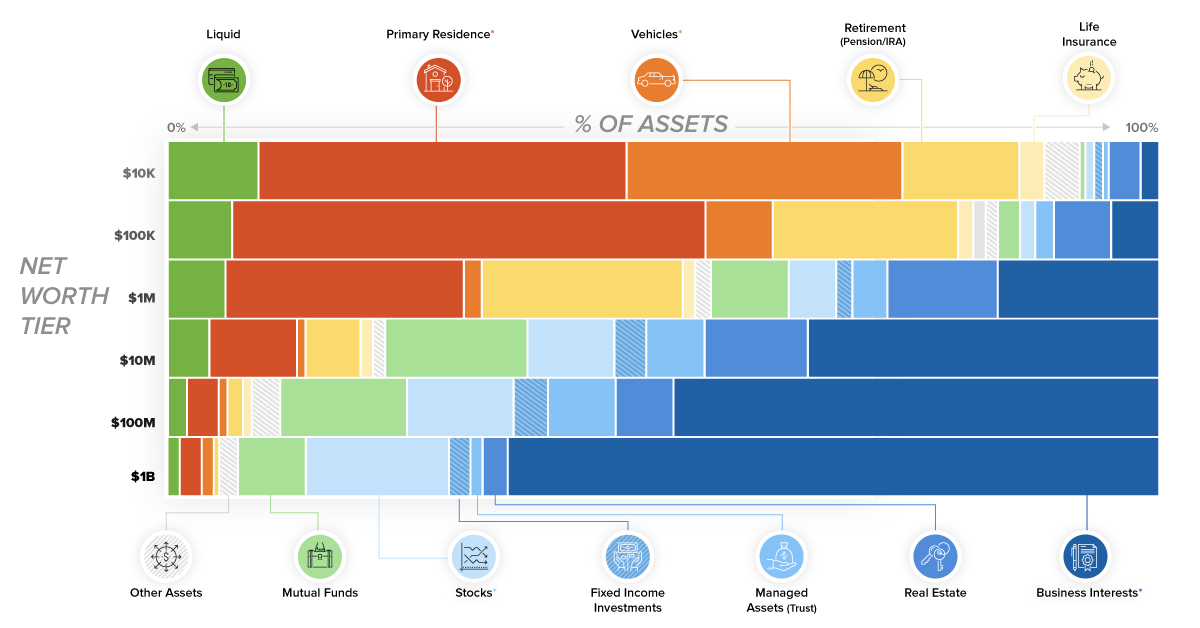
This chart breaks down the composition of assets for each tier of wealth. See what assets make up a regular person's net worth, versus that of...
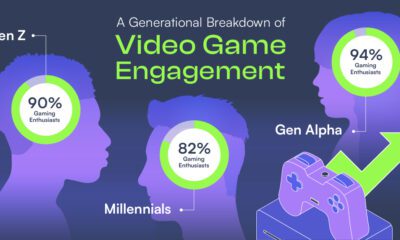
Video gaming is the most popular form of entertainment. But how people engage with video games looks different by generation.
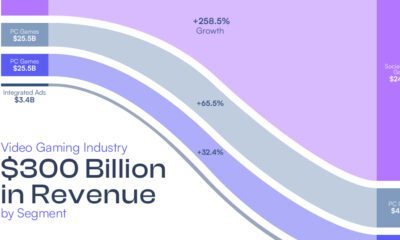
The video games industry could generate over $300 billion by 2026. Here is a break down of that revenue by source.
How has inflation impacted everyday goods like milk, flour, or fuel? This chart shows the annual change in the price of basic daily goods.
What major stories have captured the world's attention over the years? This graphic highlights the top trending Google searches since 2001.
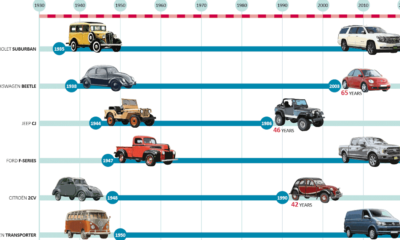
Successful cars come in many shapes and sizes. See which ones have stood the test of time in this infographic.
This map of civil unrest in the United States helps provide much needed context on how individual events fit within the nation-wide pattern over time.
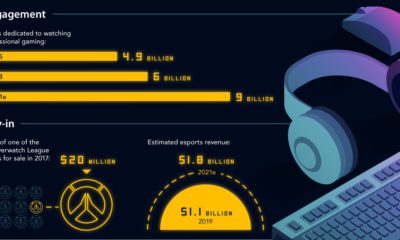
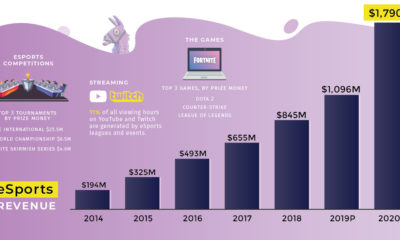
This infographic plots the journey of esports, from underground niche to a billion-dollar mainstream phenomenon—and it shows no signs of slowing down.
Everything you need to know about the eSports Boom, including the sector's rapid growth, massive prize pools, and the most valuable eSports companies today.
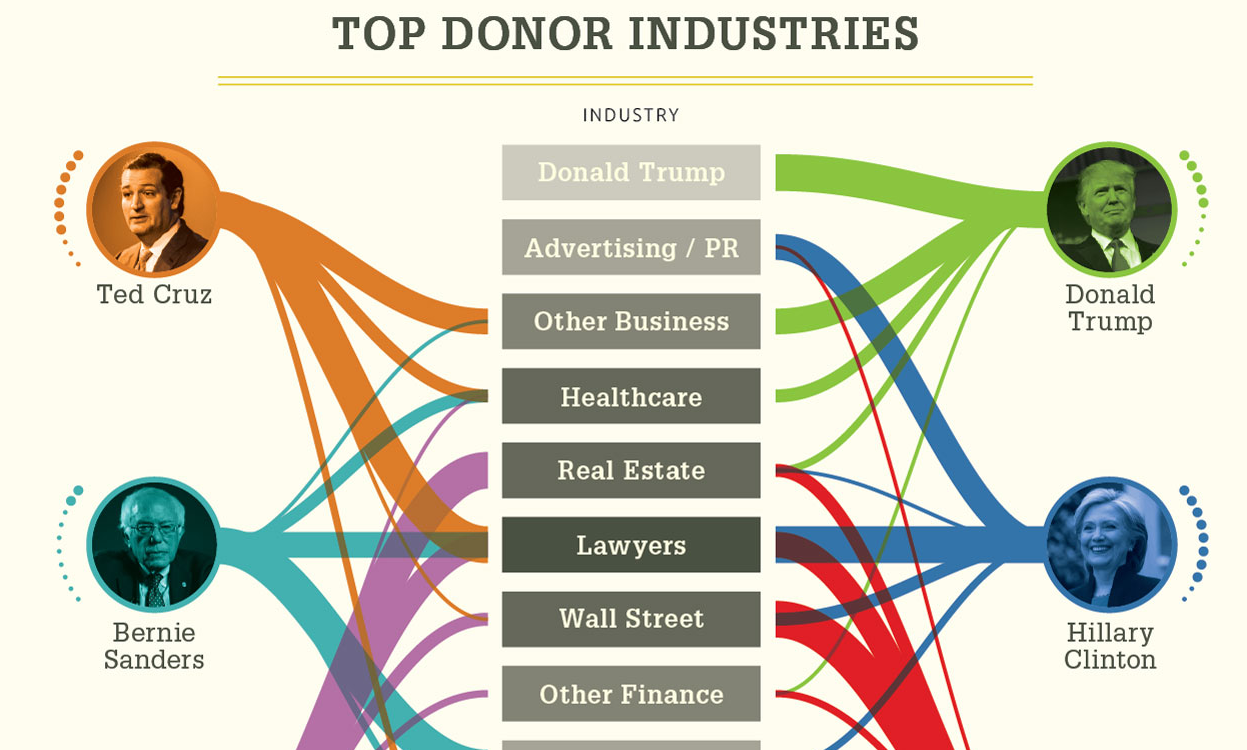
What if politicians displayed their donors on their uniforms like NASCAR drivers?