Mapped: The 10 U.S. States With the Lowest Real GDP Growth
Ranked: The World’s 50 Largest Private Equity Firms
Top 10 Countries Most in Debt to the IMF
Ranked: The Top 6 Economies by Share of Global GDP (1980-2024)
Mapped: Europe’s GDP Per Capita, by Country
Countries With the Highest Rates of Crypto Ownership
Mapped: The Number of AI Startups By Country
All of the Grants Given by the U.S. CHIPS Act
Visualizing AI Patents by Country
How Tech Logos Have Evolved Over Time
Visualizing America’s Average Retirement Savings, by Age
Visualizing the Tax Burden of Every U.S. State
Charted: What Frustrates Americans About the Tax System
Ranked: The Top 20 Countries in Debt to China
Mapped: Countries Where Recreational Cannabis is Legal
Which Countries Have the Highest Infant Mortality Rates?
Life Expectancy by Region (1950-2050F)
What Causes Preventable Child Deaths?
The Cost of an EpiPen in Major Markets
Who’s Building the Most Solar Energy?
Mapped: The Age of Energy Projects in Interconnection Queues, by State
Ranked: The Top 10 EV Battery Manufacturers in 2023
The World’s Biggest Nuclear Energy Producers
The World’s Biggest Oil Producers in 2023
Mapped: The Top Exports in Asian Countries
Mapped: U.S. States By Number of Cities Over 250,000 Residents
Mapped: U.S. Immigrants by Region
The Biggest Salt Producing Countries in 2023
Visualizing Copper Production by Country in 2023
Where the World’s Aluminum is Smelted, by Country
Visualizing Global Gold Production in 2023
How People Get Around in America, Europe, and Asia
The Carbon Footprint of Major Travel Methods
Ranking the Top 15 Countries by Carbon Tax Revenue
Ranked: The Countries With the Most Air Pollution in 2023
Top Countries By Forest Growth Since 2001
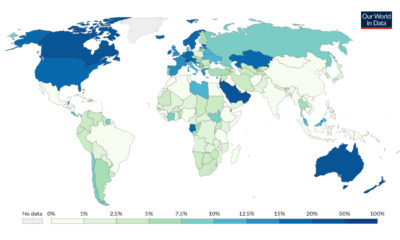
Immigrants account for 3.5% of the global population, but where are they more or less prevalent? This map shows immigration by country.
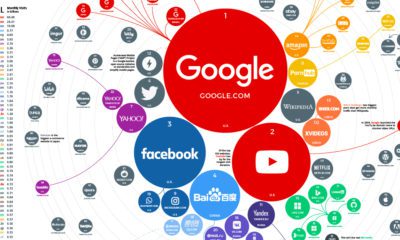
The top 100 websites ranking reveals how people around the world search for information, which services they use, and how they spend time online.
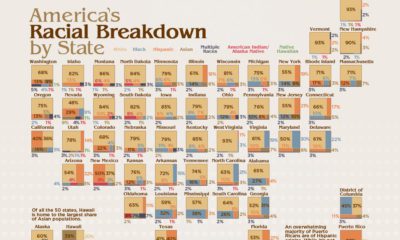
America is a cultural mosaic—nearly 40% identify as a visible minority today. Here we break down the U.S. population by race by state.
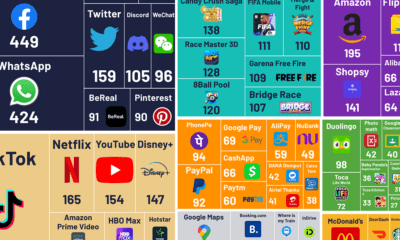
What are the world's most popular apps? This graphic visualizes the most downloaded apps, grouped together by different categories.
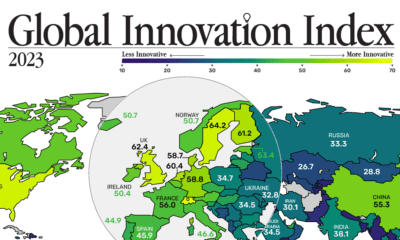
In this graphic, we show the most innovative countries in the world, and the factors underlying their innovative strength.
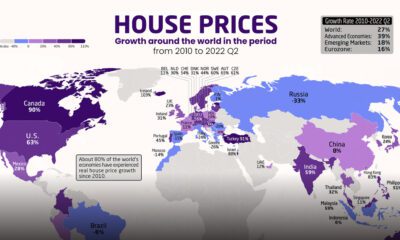
Which countries have seen the biggest spikes in housing prices? These maps show the change in real and nominal housing prices since 2010.
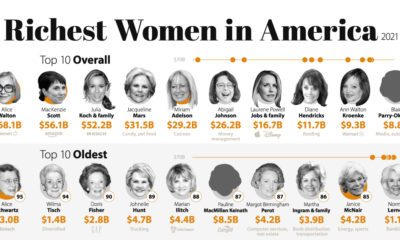
Only 12% of billionaires in the U.S. are women. Who is part of this prestigious group of the richest women in America?
Which countries have the least powerful passports? Here's how economic strength and political factors impact travel freedom in 2024.
In this graphic we explore the world’s declining fertility rate over the last 60 years and the disparity in fertility rates between nations
COVID-19 hit the global economy hard, but some companies thrived amidst the chaos. Here are the top 100 most valuable brands of 2021.


 Creator Program