Top 10 Countries Most in Debt to the IMF
Ranked: The Top 6 Economies by Share of Global GDP (1980-2024)
Mapped: Europe’s GDP Per Capita, by Country
The Growth of a $1,000 Equity Investment, by Stock Market
Mapped: The Most Valuable Company in Each Southeast Asian Country
Countries With the Highest Rates of Crypto Ownership
Mapped: The Number of AI Startups By Country
All of the Grants Given by the U.S. CHIPS Act
Visualizing AI Patents by Country
How Tech Logos Have Evolved Over Time
Visualizing America’s Average Retirement Savings, by Age
Visualizing the Tax Burden of Every U.S. State
Charted: What Frustrates Americans About the Tax System
Ranked: The Top 20 Countries in Debt to China
Mapped: Countries Where Recreational Cannabis is Legal
Which Countries Have the Highest Infant Mortality Rates?
Life Expectancy by Region (1950-2050F)
What Causes Preventable Child Deaths?
The Cost of an EpiPen in Major Markets
Who’s Building the Most Solar Energy?
Mapped: The Age of Energy Projects in Interconnection Queues, by State
Ranked: The Top 10 EV Battery Manufacturers in 2023
The World’s Biggest Nuclear Energy Producers
The World’s Biggest Oil Producers in 2023
Mapped: U.S. States By Number of Cities Over 250,000 Residents
Mapped: U.S. Immigrants by Region
Mapped: Southeast Asia’s GDP Per Capita, by Country
The Largest Earthquakes in the New York Area (1970-2024)
The Biggest Salt Producing Countries in 2023
Visualizing Copper Production by Country in 2023
Where the World’s Aluminum is Smelted, by Country
Visualizing Global Gold Production in 2023
How People Get Around in America, Europe, and Asia
The Carbon Footprint of Major Travel Methods
Ranking the Top 15 Countries by Carbon Tax Revenue
Ranked: The Countries With the Most Air Pollution in 2023
Top Countries By Forest Growth Since 2001
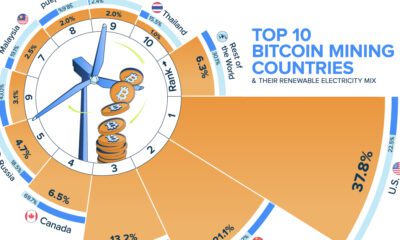
Bitcoin miners worldwide use about 348 TWh of electricity per year, as much as some countries, but just where does all that power come from?
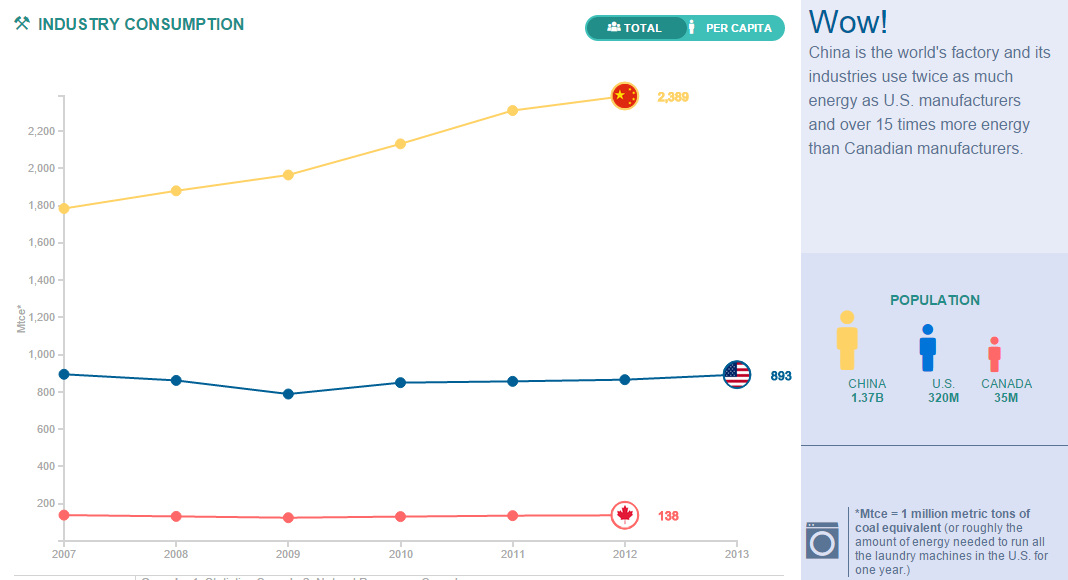
Compare the United States, China, and Canada side-by-side to see the differences in how these energy titans consume, produce, and import/export energy.
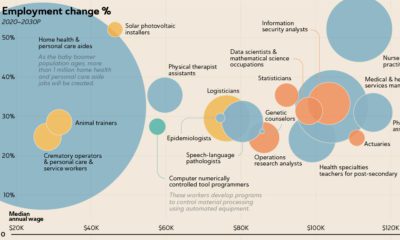
The U.S. Bureau of Labor Statistics predicts an overall job growth rate of 7.7%. Here, we show the fastest growing jobs and how much they pay.
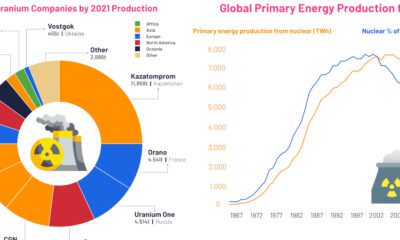
These visuals highlight the uranium mining industry and its output, as well as the trajectory of nuclear energy from 1960 to today.
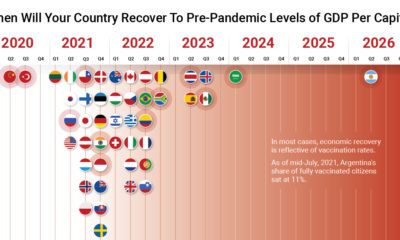
The path to COVID-19 recovery varies worldwide—some countries have already recovered, while others will not be back to normal for years.
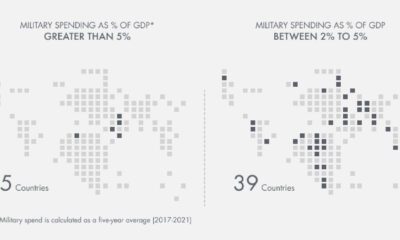
Which countries have the highest military spend relative to their economy? This visual breaks down the amount spent in each country by GDP.
We visualize the distribution of the world's uranium reserves by country, with 3 countries accounting for more than half of total reserves.
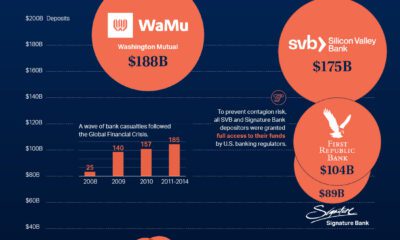
This graphic charts over 560 U.S. bank failures since 2001, including the most recent addition: First Republic Bank.
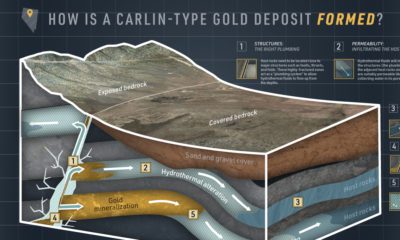
Explore everything about Carlin-type gold deposits in this infographic.
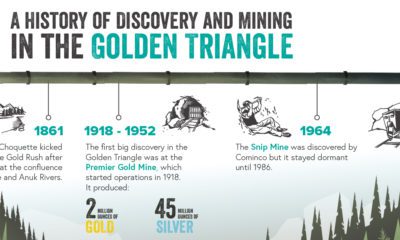
British Columbia’s Golden Triangle generates massive revenue and investments for the province, but where did it all begin?


 Creator Program