Mapped: The 10 U.S. States With the Lowest Real GDP Growth
Ranked: The World’s 50 Largest Private Equity Firms
Top 10 Countries Most in Debt to the IMF
Ranked: The Top 6 Economies by Share of Global GDP (1980-2024)
Mapped: Europe’s GDP Per Capita, by Country
Ranked: The Top Startup Cities Around the World
Visualizing the 5 Most Common Cybersecurity Mistakes
Countries With the Highest Rates of Crypto Ownership
Mapped: The Number of AI Startups By Country
All of the Grants Given by the U.S. CHIPS Act
Visualizing America’s Average Retirement Savings, by Age
Visualizing the Tax Burden of Every U.S. State
Charted: What Frustrates Americans About the Tax System
Ranked: The Top 20 Countries in Debt to China
Mapped: Countries Where Recreational Cannabis is Legal
Which Countries Have the Highest Infant Mortality Rates?
Life Expectancy by Region (1950-2050F)
What Causes Preventable Child Deaths?
The Cost of an EpiPen in Major Markets
Who’s Building the Most Solar Energy?
Mapped: The Age of Energy Projects in Interconnection Queues, by State
Ranked: The Top 10 EV Battery Manufacturers in 2023
The World’s Biggest Nuclear Energy Producers
The World’s Biggest Oil Producers in 2023
Mapped: Indian States with Cities Over 1 Million People
Mapped: The Top Export in Each EU Country
Mapped: The Top Exports in Asian Countries
Mapped: U.S. States By Number of Cities Over 250,000 Residents
The Biggest Salt Producing Countries in 2023
Visualizing Copper Production by Country in 2023
Where the World’s Aluminum is Smelted, by Country
Visualizing Global Gold Production in 2023
How People Get Around in America, Europe, and Asia
The Carbon Footprint of Major Travel Methods
Ranking the Top 15 Countries by Carbon Tax Revenue
Ranked: The Countries With the Most Air Pollution in 2023
Top Countries By Forest Growth Since 2001
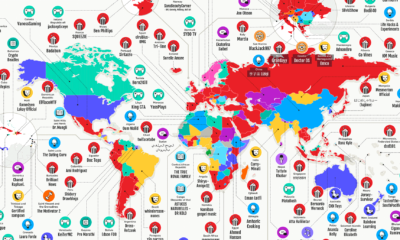
This interesting graphic gives an overview of the world’s most popular—and the highest paid—YouTubers in 187 different countries.
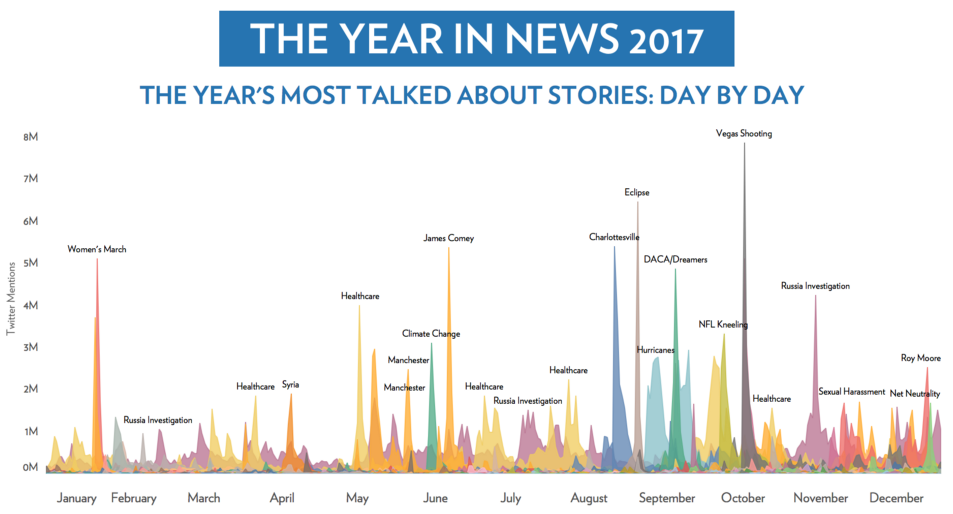
What were the most talked about news stories of 2017? This infographic crunches the data on 2.8 billion tweets to find out.
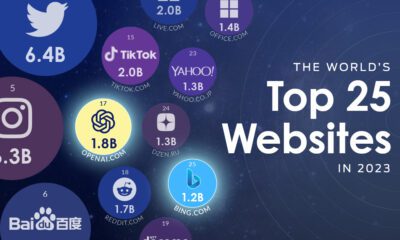
OpenAI is now one of the world's top websites, rapidly approaching the level of traffic received by TikTok and Amazon.
What does a road map of the world look like? Here’s a deep view of roads visualized by type across countries and continents.
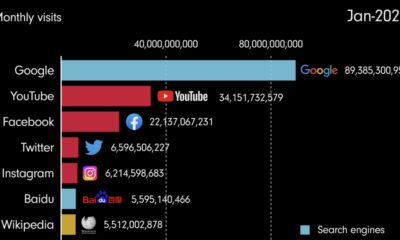
This video shows the evolution of the internet, highlighting the most popular websites from 1993 until 2022.
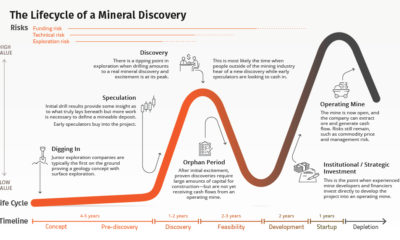
Building a mine takes time that poses risks at every stage. This graphic maps a mineral deposit from discovery to mining, showing where value is created.
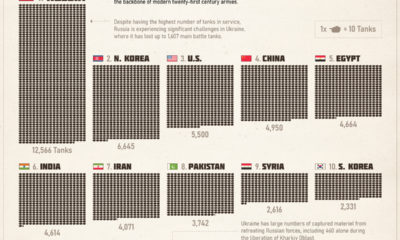
The tank remains the backbone of modern twenty-first century armies. This infographic shows what countries have the largest combat fleets.
As millions of people continue to show up for work during the COVID-19 pandemic, many face a higher risk of potential exposure to the virus.
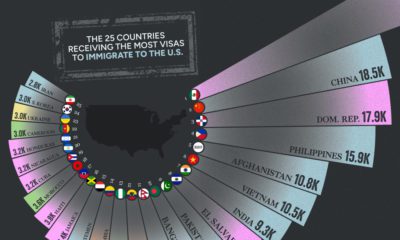
Every year, there are hundreds of thousands of U.S. immigration visas issued by the government. See which countries receive the most in this visualization.
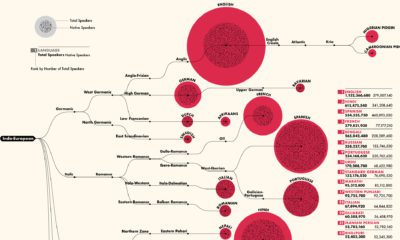
This detailed visualization breaks down the 100 most spoken languages around the world, by total and native speakers. Can you find yours on the list?


 Creator Program