Mapped: The 10 U.S. States With the Lowest Real GDP Growth
Ranked: The World’s 50 Largest Private Equity Firms
Top 10 Countries Most in Debt to the IMF
Ranked: The Top 6 Economies by Share of Global GDP (1980-2024)
Mapped: Europe’s GDP Per Capita, by Country
Countries With the Highest Rates of Crypto Ownership
Mapped: The Number of AI Startups By Country
All of the Grants Given by the U.S. CHIPS Act
Visualizing AI Patents by Country
How Tech Logos Have Evolved Over Time
Visualizing America’s Average Retirement Savings, by Age
Visualizing the Tax Burden of Every U.S. State
Charted: What Frustrates Americans About the Tax System
Ranked: The Top 20 Countries in Debt to China
Mapped: Countries Where Recreational Cannabis is Legal
Which Countries Have the Highest Infant Mortality Rates?
Life Expectancy by Region (1950-2050F)
What Causes Preventable Child Deaths?
The Cost of an EpiPen in Major Markets
Who’s Building the Most Solar Energy?
Mapped: The Age of Energy Projects in Interconnection Queues, by State
Ranked: The Top 10 EV Battery Manufacturers in 2023
The World’s Biggest Nuclear Energy Producers
The World’s Biggest Oil Producers in 2023
Mapped: The Top Exports in Asian Countries
Mapped: U.S. States By Number of Cities Over 250,000 Residents
Mapped: U.S. Immigrants by Region
The Biggest Salt Producing Countries in 2023
Visualizing Copper Production by Country in 2023
Where the World’s Aluminum is Smelted, by Country
Visualizing Global Gold Production in 2023
How People Get Around in America, Europe, and Asia
The Carbon Footprint of Major Travel Methods
Ranking the Top 15 Countries by Carbon Tax Revenue
Ranked: The Countries With the Most Air Pollution in 2023
Top Countries By Forest Growth Since 2001
This infographic shows the net minimum wage across 67 countries, as of January 2023. A breakdown by U.S. state is also included.
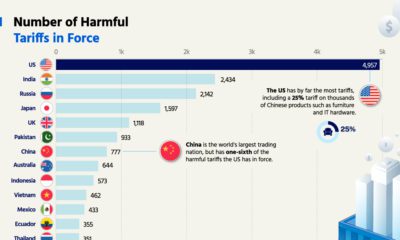
The U.S. has by far the most harmful tariffs, with nearly 5,000 in force. Which economy has the least tariffs?
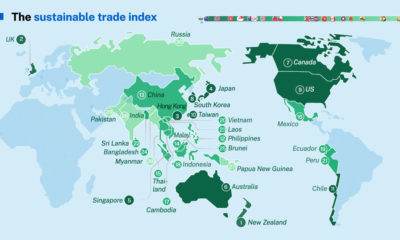
See which economies have the most sustainable trade policies in the Hinrich Foundation's 2022 Sustainable Trade Index.
This visualization breaks down how household wealth is distributed around the world. Just 10 countries now account for 75% of total household wealth.
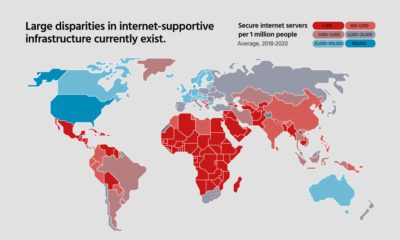
In this infographic, we examine the current state of digital fragmentation and it’s implications on the world.
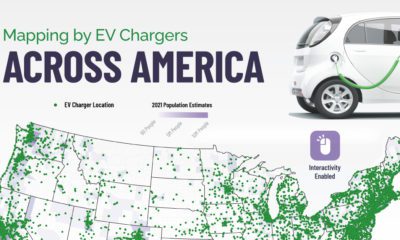
Looking for an EV charging station in the states? This interactive map contains every EV charging station in America.
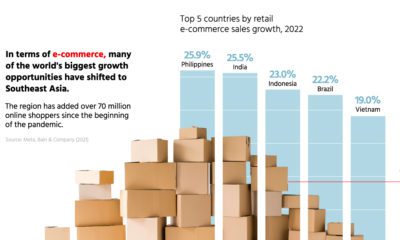
Asia's digital economy is expanding quicker than ever, but cooperation between governments is needed to reduce barriers.
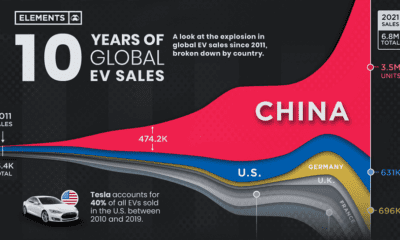
Global EV sales have grown exponentially, more than doubling in 2021 to 6.8 million units. Here's a look at EV sales by country since 2011.
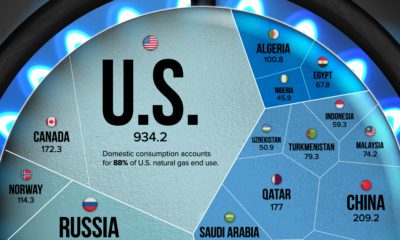
Natural gas prices have risen since Russia's invasion of Ukraine. This visualization highlights the world’s largest natural gas producers.
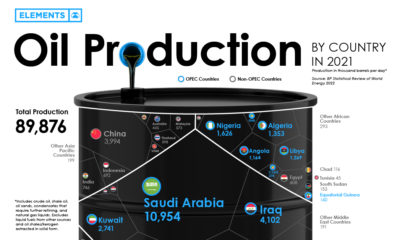
Global oil production averaged 89.8 million barrels of oil per day in 2021. Here are the world's largest oil producers.