Mapped: The 10 U.S. States With the Lowest Real GDP Growth
Ranked: The World’s 50 Largest Private Equity Firms
Top 10 Countries Most in Debt to the IMF
Ranked: The Top 6 Economies by Share of Global GDP (1980-2024)
Mapped: Europe’s GDP Per Capita, by Country
Countries With the Highest Rates of Crypto Ownership
Mapped: The Number of AI Startups By Country
All of the Grants Given by the U.S. CHIPS Act
Visualizing AI Patents by Country
How Tech Logos Have Evolved Over Time
Visualizing America’s Average Retirement Savings, by Age
Visualizing the Tax Burden of Every U.S. State
Charted: What Frustrates Americans About the Tax System
Ranked: The Top 20 Countries in Debt to China
Mapped: Countries Where Recreational Cannabis is Legal
Which Countries Have the Highest Infant Mortality Rates?
Life Expectancy by Region (1950-2050F)
What Causes Preventable Child Deaths?
The Cost of an EpiPen in Major Markets
Who’s Building the Most Solar Energy?
Mapped: The Age of Energy Projects in Interconnection Queues, by State
Ranked: The Top 10 EV Battery Manufacturers in 2023
The World’s Biggest Nuclear Energy Producers
The World’s Biggest Oil Producers in 2023
Mapped: The Top Exports in Asian Countries
Mapped: U.S. States By Number of Cities Over 250,000 Residents
Mapped: U.S. Immigrants by Region
The Biggest Salt Producing Countries in 2023
Visualizing Copper Production by Country in 2023
Where the World’s Aluminum is Smelted, by Country
Visualizing Global Gold Production in 2023
How People Get Around in America, Europe, and Asia
The Carbon Footprint of Major Travel Methods
Ranking the Top 15 Countries by Carbon Tax Revenue
Ranked: The Countries With the Most Air Pollution in 2023
Top Countries By Forest Growth Since 2001
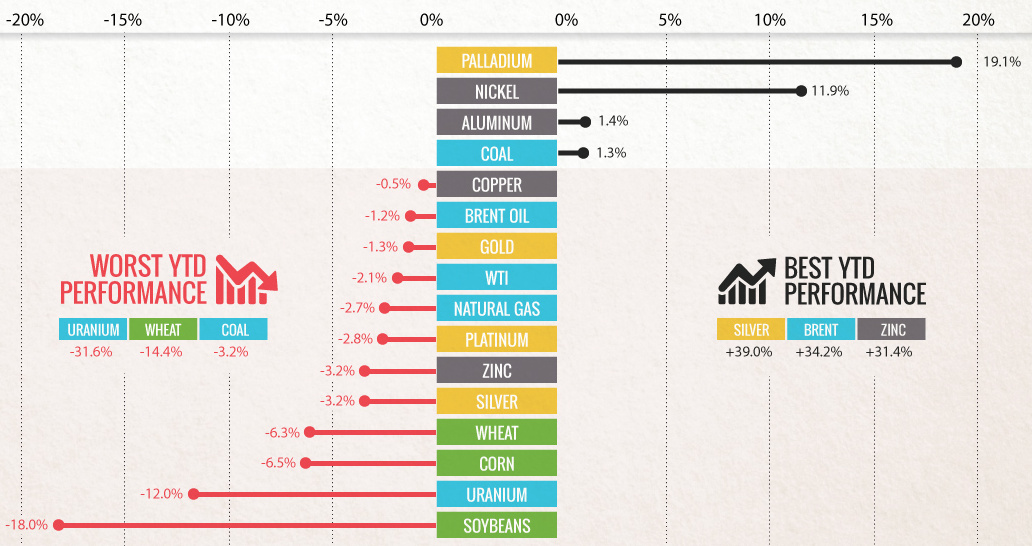
Commodities slumped in Q3 as buyers 'sold in May and went away'. Can commodities shake the summer slump with a U.S. election and OPEC deal in...
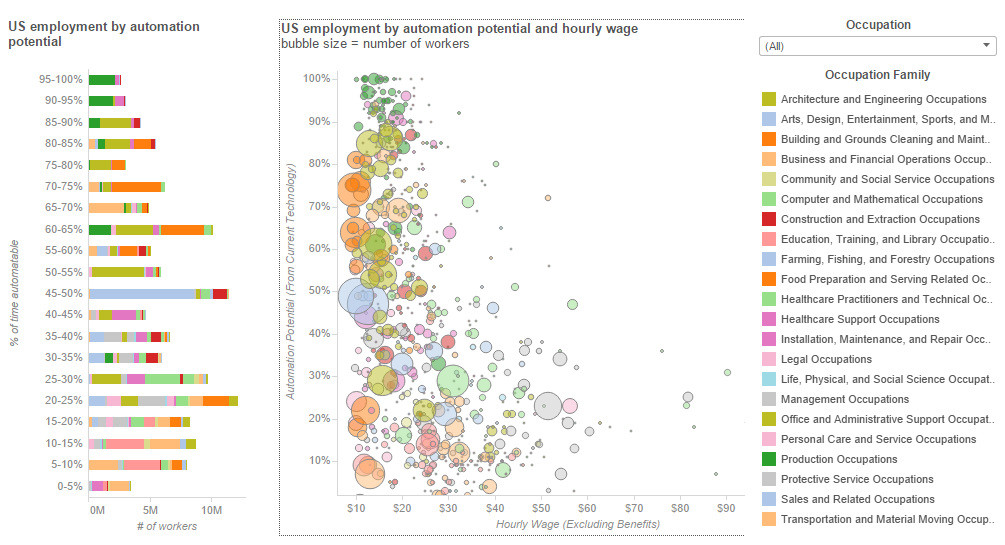
What jobs are most likely to be done by robots in the future? This interactive data visualization shows the automation potential of nearly 800 jobs.
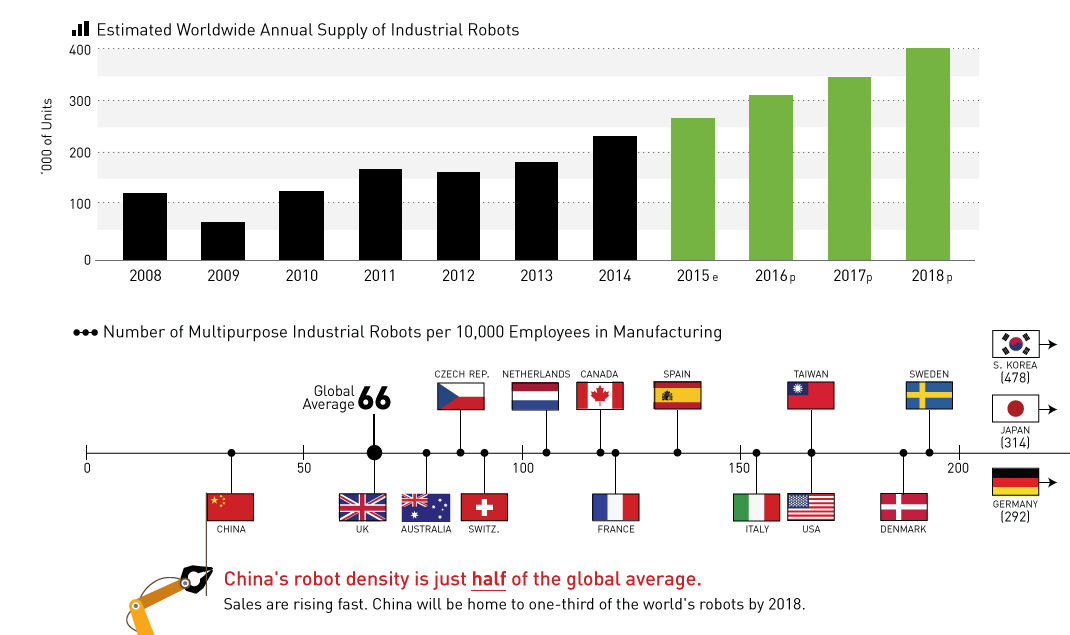
There will be 1.3 million new industrial robot installations between 2015 and 2018.
Put down your turkey leftovers - it's time to recap Visual Capitalist's top 15 infographics, data visualizations, and charts of 2015.
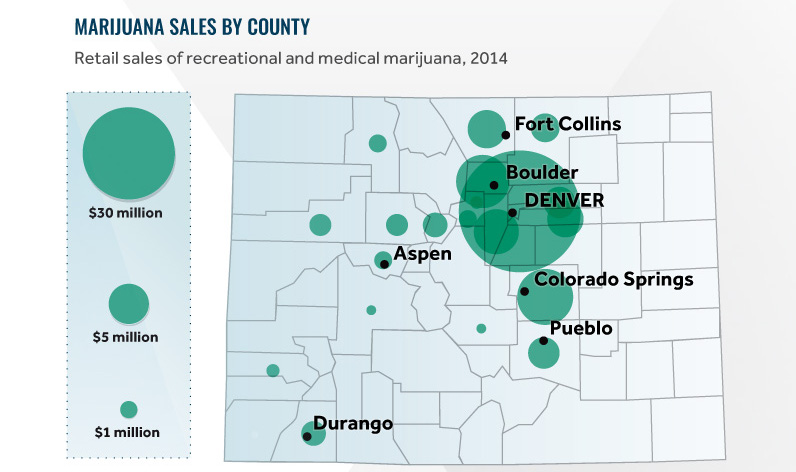
Big changes in public opinion and legalization are affecting the future of cannabis in North America. See five trends investors should know in this infographic.
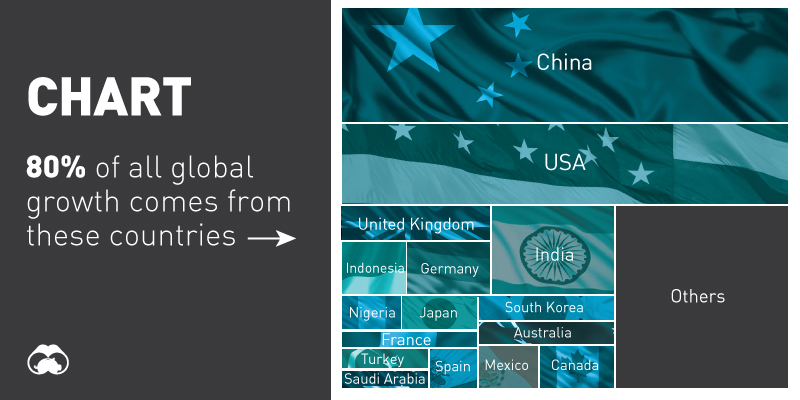
Which countries contribute the most to global economic growth? Over 80% of all growth is from 16 countries, and over half of all growth is from...
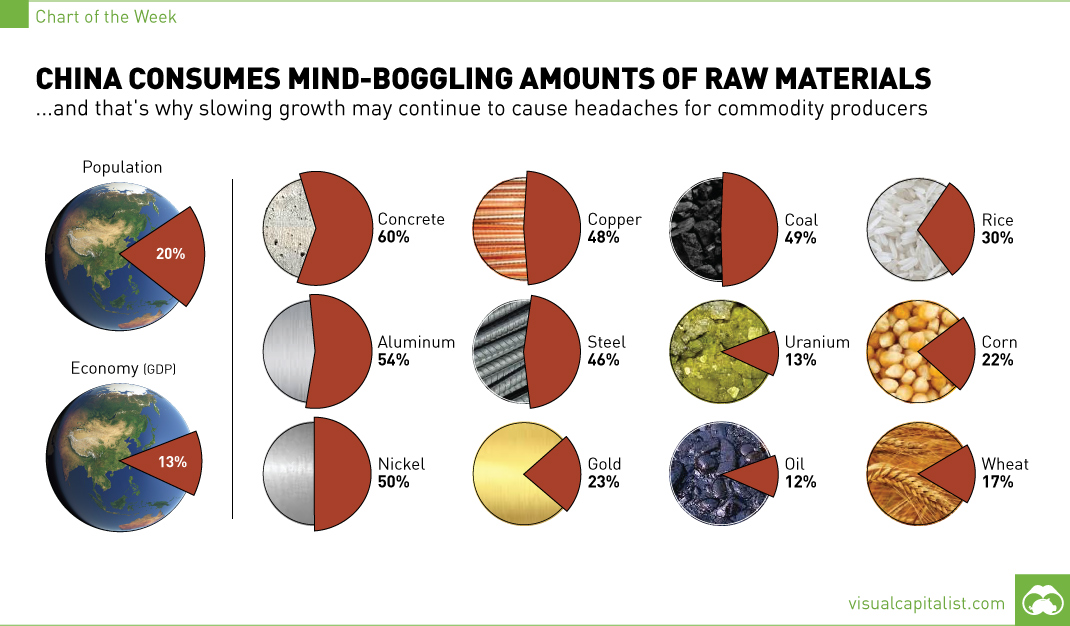
The 1.4 billion people living in China account for 13% of global GDP, but this chart shows that for commodity producers, the country means so much...
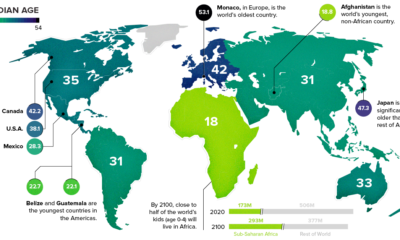
This chart takes a look at the median age of every continent, while also breaking down the youngest and oldest countries in the world.
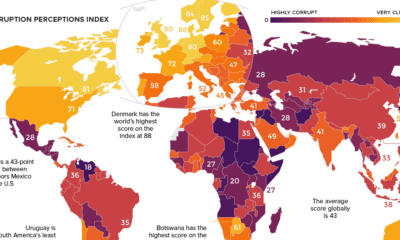
Which countries are the most (and least) corrupt? This world map shows the figures for the Corruption Perceptions Index (CPI) for 2018.
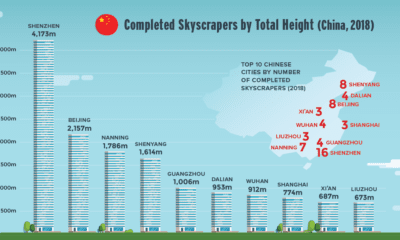
Nearly 150 skyscrapers were completed around the world last year. Find out which cities and regions are growing skyward the fastest.