Technology
Domo Arigato, Mr. Roboto [Chart]
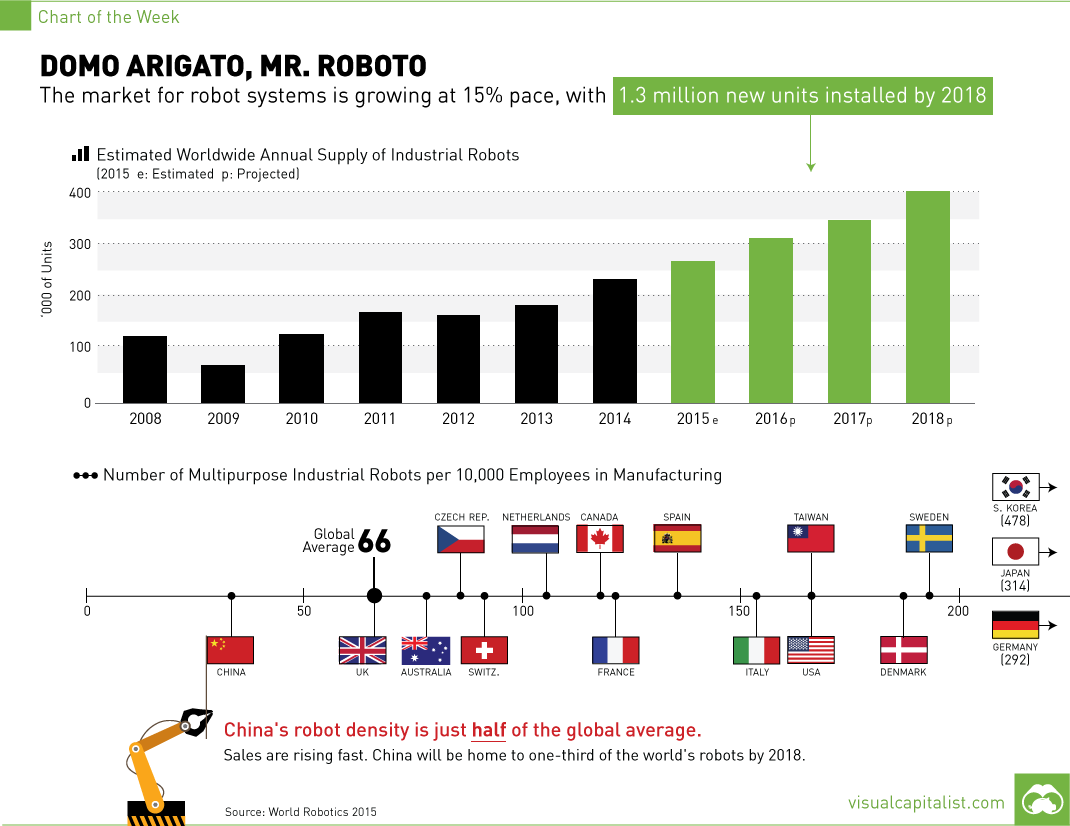
Domo Arigato, Mr. Roboto
Robot market growing at 15%, with 1.3 million new industrial robot installations by 2018
The Chart of the Week is a weekly Visual Capitalist feature on Fridays.
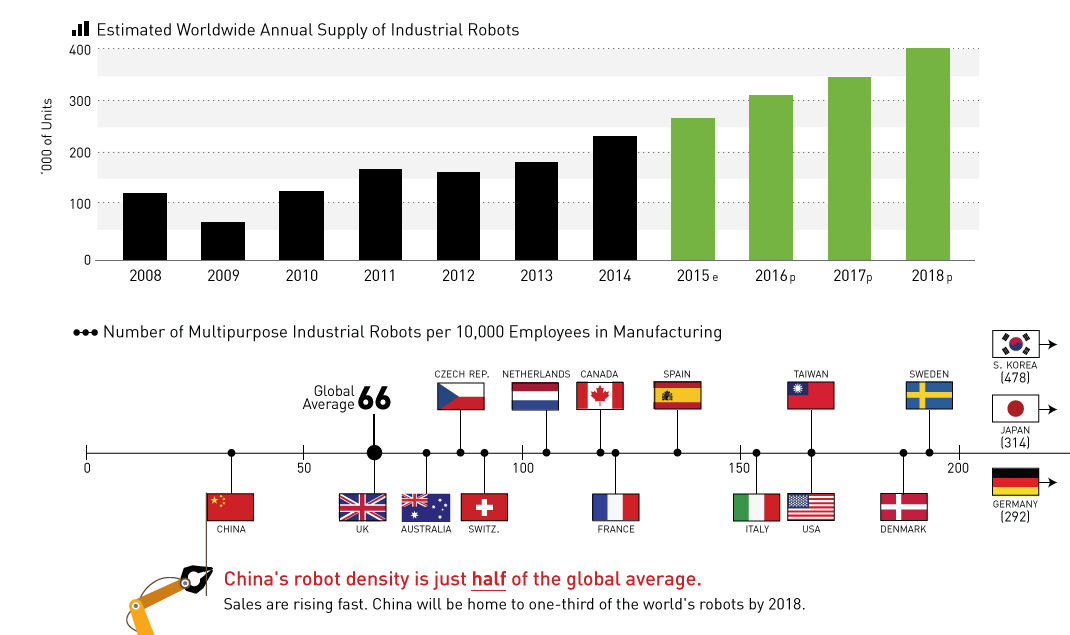
The market for industrial robot installations has been on a skyward trend since 2009, and it is not expected to slow down any time soon. According to the World Robotics 2015 report, the market for industrial robots was approximated at $32 billion in 2014, and in the coming years it is expected to continue to grow at a compound annual growth rate (CAGR) of at least 15%.
That means between 2015 and 2018, it’s anticipated that 1.3 million industrial robots will be installed worldwide. This will bring the stock of operational robots up to just over 2.3 million, mostly working in the automotive and electronics sectors.
For how long can the global robot population continue to grow?
Robot Density
Perhaps the most interesting way to peek into the future of industrial robot installations is to look at potential sales in China.
Currently, the world’s most populous nation has a density of robots that is about half of the world average, equal to just 36 robots for every 10,000 manufacturing workers in China.
However, this is changing fast. It’s been the largest market for robots since 2013, and in 2014 the country bought 57,100 robots – the highest quantity ever recorded in a year. By 2018, one in every three robots in operation around the world will be in China.
What will happen if China’s density approaches that of other robot industrial centers?
Highly automated countries such as Germany, Japan, and South Korea all have robot densities that are multiples higher. South Korea, for example, has 478 industrial robots for every 10,000 workers – a ratio that is 13x higher than China’s.
With this kind of potential for growth, it’s clear that this is only the start of the robot story.


Technology
Visualizing AI Patents by Country
See which countries have been granted the most AI patents each year, from 2012 to 2022.


Visualizing AI Patents by Country
This was originally posted on our Voronoi app. Download the app for free on iOS or Android and discover incredible data-driven charts from a variety of trusted sources.
This infographic shows the number of AI-related patents granted each year from 2010 to 2022 (latest data available). These figures come from the Center for Security and Emerging Technology (CSET), accessed via Stanford University’s 2024 AI Index Report.
From this data, we can see that China first overtook the U.S. in 2013. Since then, the country has seen enormous growth in the number of AI patents granted each year.
| Year | China | EU and UK | U.S. | RoW | Global Total |
|---|---|---|---|---|---|
| 2010 | 307 | 137 | 984 | 571 | 1,999 |
| 2011 | 516 | 129 | 980 | 581 | 2,206 |
| 2012 | 926 | 112 | 950 | 660 | 2,648 |
| 2013 | 1,035 | 91 | 970 | 627 | 2,723 |
| 2014 | 1,278 | 97 | 1,078 | 667 | 3,120 |
| 2015 | 1,721 | 110 | 1,135 | 539 | 3,505 |
| 2016 | 1,621 | 128 | 1,298 | 714 | 3,761 |
| 2017 | 2,428 | 144 | 1,489 | 1,075 | 5,136 |
| 2018 | 4,741 | 155 | 1,674 | 1,574 | 8,144 |
| 2019 | 9,530 | 322 | 3,211 | 2,720 | 15,783 |
| 2020 | 13,071 | 406 | 5,441 | 4,455 | 23,373 |
| 2021 | 21,907 | 623 | 8,219 | 7,519 | 38,268 |
| 2022 | 35,315 | 1,173 | 12,077 | 13,699 | 62,264 |
In 2022, China was granted more patents than every other country combined.
While this suggests that the country is very active in researching the field of artificial intelligence, it doesn’t necessarily mean that China is the farthest in terms of capability.
Key Facts About AI Patents
According to CSET, AI patents relate to mathematical relationships and algorithms, which are considered abstract ideas under patent law. They can also have different meaning, depending on where they are filed.
In the U.S., AI patenting is concentrated amongst large companies including IBM, Microsoft, and Google. On the other hand, AI patenting in China is more distributed across government organizations, universities, and tech firms (e.g. Tencent).
In terms of focus area, China’s patents are typically related to computer vision, a field of AI that enables computers and systems to interpret visual data and inputs. Meanwhile America’s efforts are more evenly distributed across research fields.
Learn More About AI From Visual Capitalist
If you want to see more data visualizations on artificial intelligence, check out this graphic that shows which job departments will be impacted by AI the most.

-

 Markets1 week ago
U.S. Debt Interest Payments Reach $1 Trillion
-

 Business2 weeks ago
Charted: Big Four Market Share by S&P 500 Audits
-

 Markets2 weeks ago
Ranked: The Most Valuable Housing Markets in America
-

 Money2 weeks ago
Which States Have the Highest Minimum Wage in America?
-

 AI2 weeks ago
Ranked: Semiconductor Companies by Industry Revenue Share
-

 Markets2 weeks ago
Ranked: The World’s Top Flight Routes, by Revenue
-

 Countries2 weeks ago
Population Projections: The World’s 6 Largest Countries in 2075
-

 Markets2 weeks ago
The Top 10 States by Real GDP Growth in 2023