Energy
The Next Big Hurdle for Oil and Gas is Water Use
In The Rime of the Ancient Mariner from 1834, English poet Samuel Taylor Coleridge famously quipped “Water, water, everywhere / But not a drop to drink”. The lines speak to the irony of sailing the high seas: there’s unfathomable amounts of water in every direction, but it’s definitely not going to quench the thirst of any sailor.
Surprisingly, the situation is not as different on land as you might think.
In some counties in the U.S., especially those with lots of oil and gas activity, there are billions of gallons of waste water, brackish water, or saline water that aren’t potable for human consumption. At the same time, these counties are receiving limited rainfall, and freshwater has become an increasingly scarce and valuable commodity.
Water Innovation is Needed
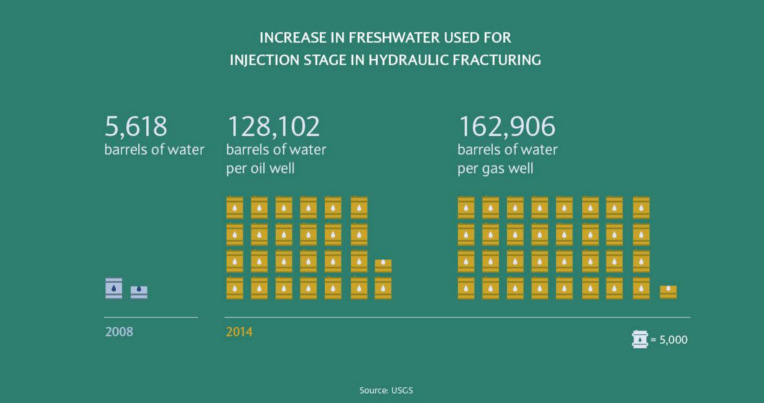
The fact is, horizontal drilling and fracking operations use large amounts of water. In 2008, an average of just 5,618 barrels of water were used for the injection stage of fracking according to the USGS. In 2014, that ballooned to 128,102 barrels of water for a oil well, and 162,906 barrels for a gas well.
Simultaneously, the Government Accountability Office estimates that 40 of 50 states have at least one region that will face some kind of water shortage by 2023. This crisis has increased social and regulatory pressures on oil and gas firms, while making the supply of usable water less dependable.
Today’s infographic comes to us from Barclays Bank, and it details this situation in depth. Further, Barclays explains how oil and gas companies will need to innovate their way out of the problem to secure new water supply and reduce costs – all while maintaining a social license to operate.

Barclays sees this problem as an opportunity: by re-thinking water use and disposal, and by turning recycled water into a new resource for other industries, oil and gas can decrease costs while giving a boost to their social license to operate.


Who’s Building the Most Solar Energy?
This was originally posted on our Voronoi app. Download the app for free on iOS or Android and discover incredible data-driven charts from a variety of trusted sources.
In 2023, solar energy accounted for three-quarters of renewable capacity additions worldwide. Most of this growth occurred in Asia, the EU, and the U.S., continuing a trend observed over the past decade.
In this graphic, we illustrate the rise in installed solar photovoltaic (PV) capacity in China, the EU, and the U.S. between 2010 and 2022, measured in gigawatts (GW). Bruegel compiled the data..
Chinese Dominance
As of 2022, China’s total installed capacity stands at 393 GW, nearly double that of the EU’s 205 GW and surpassing the USA’s total of 113 GW by more than threefold in absolute terms.
| Installed solar capacity (GW) | China | EU27 | U.S. |
|---|---|---|---|
| 2022 | 393.0 | 205.5 | 113.0 |
| 2021 | 307.0 | 162.7 | 95.4 |
| 2020 | 254.0 | 136.9 | 76.4 |
| 2019 | 205.0 | 120.1 | 61.6 |
| 2018 | 175.3 | 104.0 | 52.0 |
| 2017 | 130.8 | 96.2 | 43.8 |
| 2016 | 77.8 | 91.5 | 35.4 |
| 2015 | 43.6 | 87.7 | 24.2 |
| 2014 | 28.4 | 83.6 | 18.1 |
| 2013 | 17.8 | 79.7 | 13.3 |
| 2012 | 6.7 | 71.1 | 8.6 |
| 2011 | 3.1 | 53.3 | 5.6 |
| 2010 | 1.0 | 30.6 | 3.4 |
Since 2017, China has shown a compound annual growth rate (CAGR) of approximately 25% in installed PV capacity, while the USA has seen a CAGR of 21%, and the EU of 16%.
Additionally, China dominates the production of solar power components, currently controlling around 80% of the world’s solar panel supply chain.
In 2022, China’s solar industry employed 2.76 million individuals, with manufacturing roles representing approximately 1.8 million and the remaining 918,000 jobs in construction, installation, and operations and maintenance.
The EU industry employed 648,000 individuals, while the U.S. reached 264,000 jobs.
According to the IEA, China accounts for almost 60% of new renewable capacity expected to become operational globally by 2028.
Despite the phasing out of national subsidies in 2020 and 2021, deployment of solar PV in China is accelerating. The country is expected to reach its national 2030 target for wind and solar PV installations in 2024, six years ahead of schedule.

-

 Technology1 week ago
Countries With the Highest Rates of Crypto Ownership
-

 Mining7 days ago
Visualizing Copper Production by Country in 2023
-

 Politics7 days ago
Charted: How Americans Feel About Federal Government Agencies
-

 Healthcare1 week ago
Which Countries Have the Highest Infant Mortality Rates?
-

 Demographics1 week ago
Mapped: U.S. Immigrants by Region
-

 Economy1 week ago
Mapped: Southeast Asia’s GDP Per Capita, by Country
-

 Automotive1 week ago
How People Get Around in America, Europe, and Asia
-

 Personal Finance1 week ago
Visualizing the Tax Burden of Every U.S. State