Wealth
Mapped: How Much Does it Take to be the Top 1% in Each U.S. State?
How Much Does it Take to be the Top 1% in Each U.S. State?
There’s an old saying: everyone thinks that they’re middle-class.
But how many people think, or know, that they really belong to the top 1% in the country?
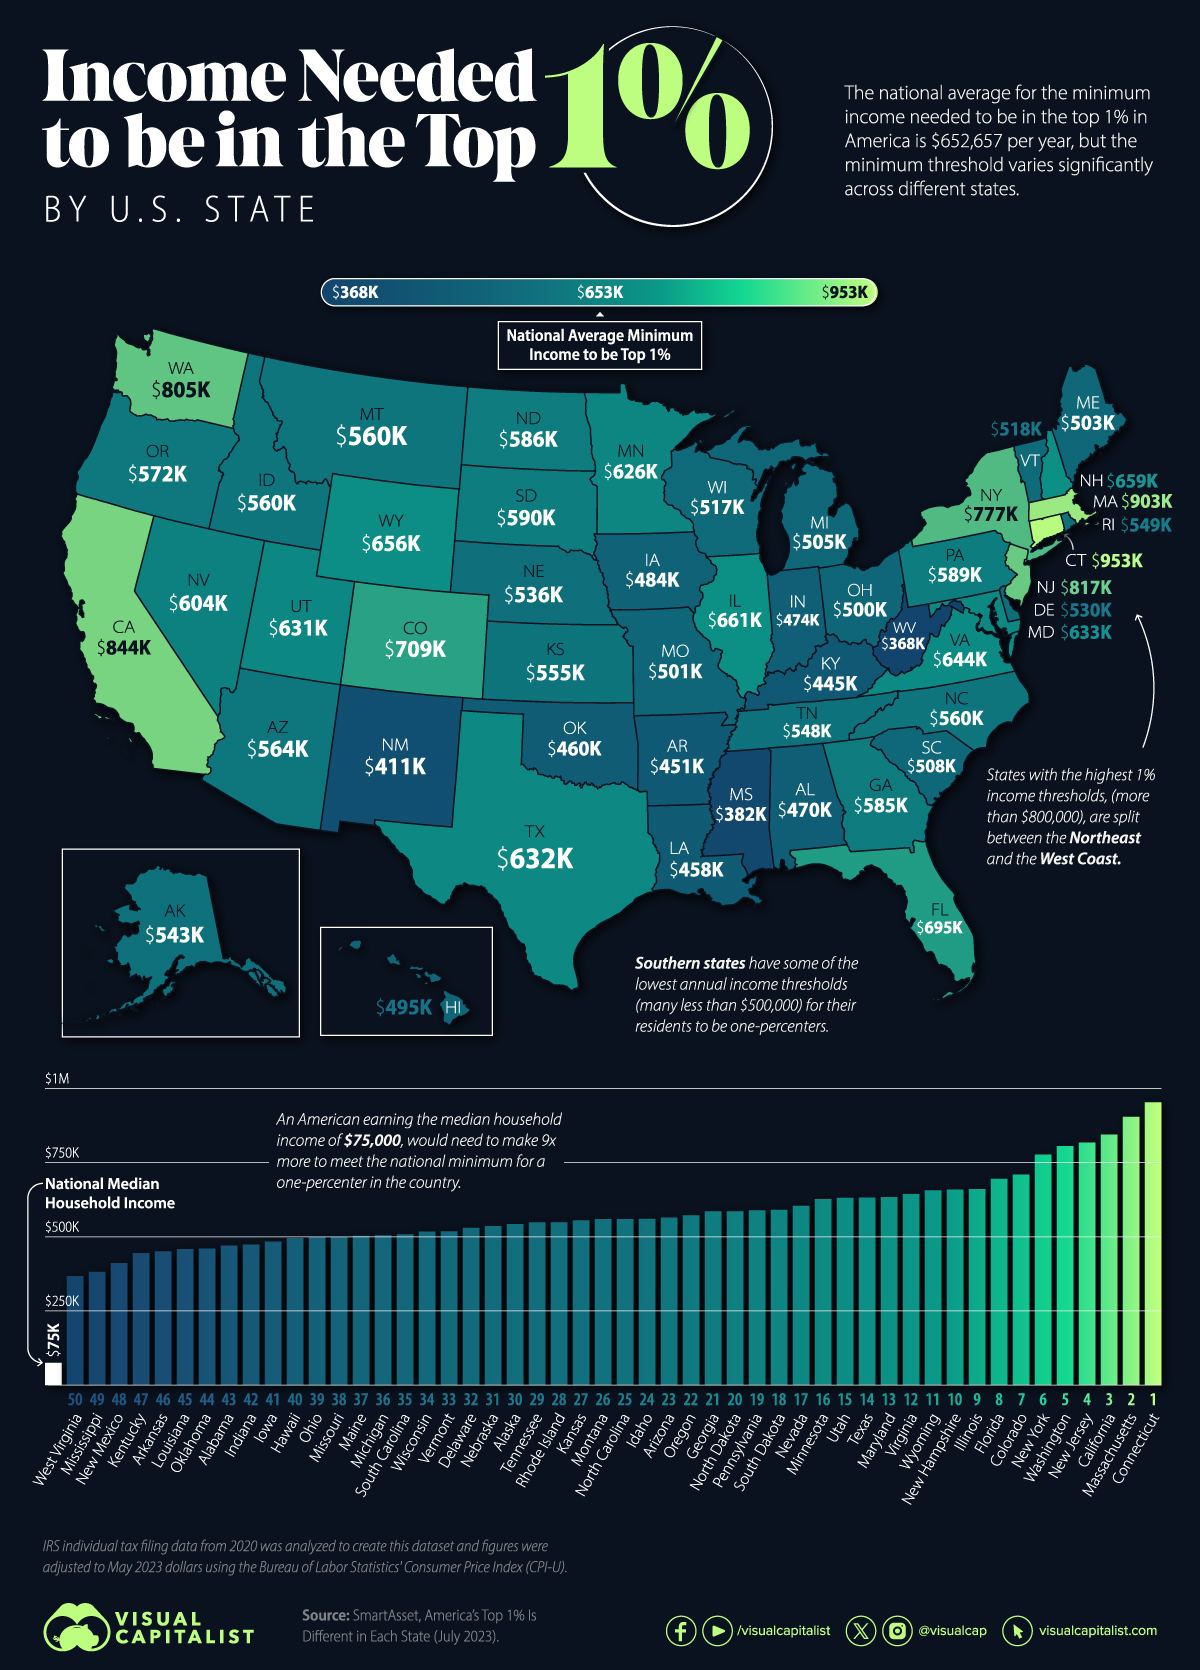
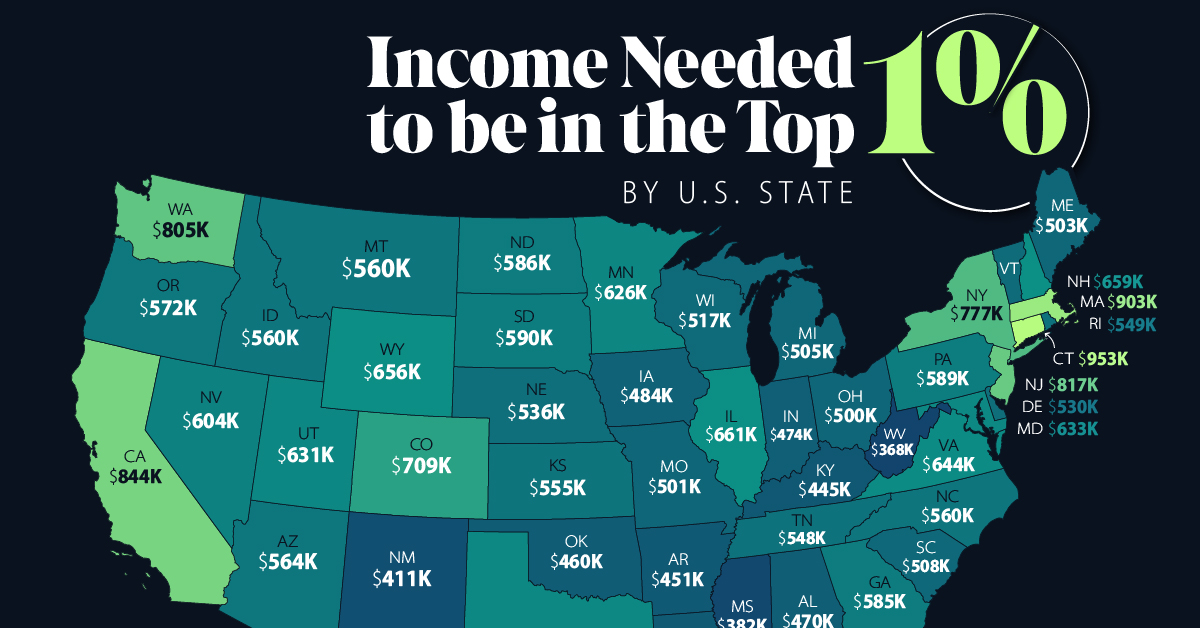
Data from personal finance advisory services company, SmartAsset, reveals the annual income threshold at which a household can be considered part of the top 1% in their state.
Some states demand a much higher yearly earnings from their residents to be a part of the rarefied league, but which ones are they, and how much does one need to earn to make it to the very top echelon of income?
Ranking U.S. States By Income to Be in the Top 1%
At the top of the list, a household in Connecticut needs to earn nearly $953,000 annually to be part of the one-percenters. This is the highest minimum threshold across the country.
In the same region, Massachusetts requires a minimum annual earnings of $903,401 from its top 1% residents.
Here’s the list of all 50 U.S. states along with the annual income needed to be in the 1%.
| Rank | State | Top 1% Income Threshold | Top 1% Tax Rate (% of annual income) |
|---|---|---|---|
| 1 | Connecticut | $952,902 | 28.40% |
| 2 | Massachusetts | $903,401 | 27.15% |
| 3 | California | $844,266 | 26.95% |
| 4 | New Jersey | $817,346 | 28.01% |
| 5 | Washington | $804,853 | 25.99% |
| 6 | New York | $776,662 | 28.29% |
| 7 | Colorado | $709,092 | 25.86% |
| 8 | Florida | $694,987 | 25.82% |
| 9 | Illinois | $660,810 | 26.35% |
| 10 | New Hampshire | $659,037 | 26.25% |
| 11 | Wyoming | $656,118 | 24.79% |
| 12 | Virginia | $643,848 | 26.11% |
| N/A | National Average | $652,657 | N/A |
| 13 | Maryland | $633,333 | 25.94% |
| 14 | Texas | $631,849 | 25.83% |
| 15 | Utah | $630,544 | 23.77% |
| 16 | Minnesota | $626,451 | 25.53% |
| 17 | Nevada | $603,751 | 25.19% |
| 18 | South Dakota | $590,373 | 22.99% |
| 19 | Pennsylvania | $588,702 | 24.95% |
| 20 | North Dakota | $585,556 | 24.76% |
| 21 | Georgia | $585,397 | 25.06% |
| 22 | Oregon | $571,813 | 24.66% |
| 23 | Arizona | $564,031 | 25.22% |
| 24 | Idaho | $560,040 | 23.17% |
| 25 | North Carolina | $559,762 | 25.31% |
| 26 | Montana | $559,656 | 24.46% |
| 27 | Kansas | $554,912 | 25.03% |
| 28 | Rhode Island | $548,531 | 25.26% |
| 29 | Tennessee | $548,329 | 25.12% |
| 30 | Alaska | $542,824 | 25.38% |
| 31 | Nebraska | $535,651 | 24.10% |
| 32 | Delaware | $529,928 | 25.37% |
| 33 | Vermont | $518,039 | 23.63% |
| 34 | Wisconsin | $517,321 | 24.90% |
| 35 | South Carolina | $508,427 | 24.40% |
| 36 | Michigan | $504,671 | 25.01% |
| 37 | Maine | $502,605 | 24.04% |
| 38 | Missouri | $500,626 | 24.93% |
| 39 | Ohio | $500,253 | 25.09% |
| 40 | Hawaii | $495,263 | 24.12% |
| 41 | Iowa | $483,985 | 24.09% |
| 42 | Indiana | $473,685 | 24.55% |
| 43 | Alabama | $470,341 | 23.82% |
| 44 | Oklahoma | $460,172 | 23.68% |
| 45 | Louisiana | $458,269 | 24.80% |
| 46 | Arkansas | $450,700 | 21.11% |
| 47 | Kentucky | $445,294 | 24.14% |
| 48 | New Mexico | $411,395 | 23.35% |
| 49 | Mississippi | $381,919 | 23.04% |
| 50 | West Virginia | $367,582 | 23.26% |
| N/A | National Median Household Income | $75,000 | N/A |
California ($844,266), New Jersey ($817,346), and Washington ($804,853) round out the top five states with the highest minimum thresholds to make it to their exclusive rich club.
On the other end of the spectrum, the top one-percenters in West Virginia make a minimum of $367,582 a year, the lowest of all the states, and about one-third of the threshold in Connecticut. And just down southwest of the Mountain State, Mississippi’s one-percenters need to make at least $381,919 a year to qualify for the 1%.
A quick glance at the map above also reveals some regional insights.
The Northeast and West Coast, with their large urban and economic hubs, have higher income entry requirements for the top 1% than states in the American South.
This also correlates to the median income by state, a measure showing Massachusetts households make nearly $90,000 a year, compared to Mississippians who take home $49,000 annually.
How Much Do the Top 1% Pay in Taxes?
Meanwhile, if one does make it to the top 1% in states like Connecticut and Massachusetts, expect to pay more in taxes than other states, according to SmartAsset’s analysis.
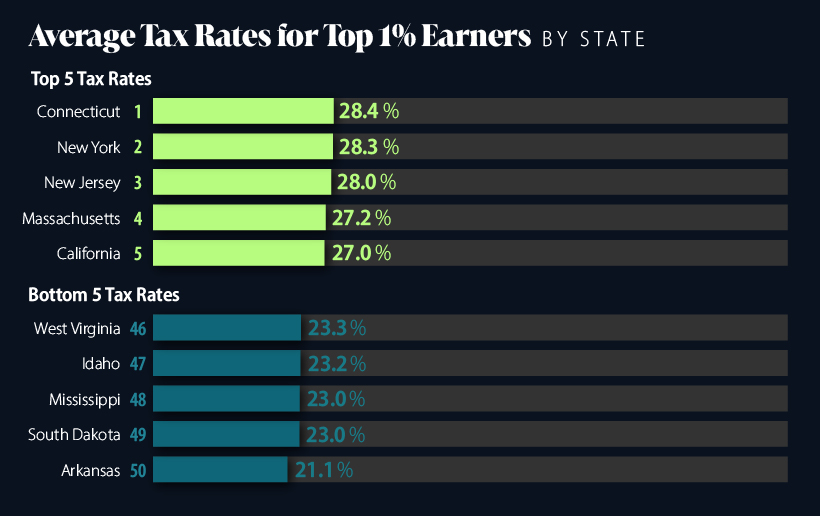
The one-percenters in the top five states pay, on average, between 26–28% of their income in tax, compared to those in the bottom five who pay between 21–23%.
And this pattern exists through the dataset, with higher top 1% income thresholds correlating with higher average tax rates for the wealthy.
| State Ranks | Median Tax Rate |
|---|---|
| Top 10 | 26.65% |
| 20-30 | 25.09% |
| 30-40 | 24.65% |
| 10-20 | 25.07% |
| 40-50 | 23.75% |
These higher tax rates point to attempts to reign in the increasing wealth disparity in the nation where the top 1% hold more than one-third of the country’s wealth, up from 27% in 1989.
Where Does This Data Come From?
Source: SmartAsset’s America’s Top 1% Is Different in Each State uses data from 2020 individual tax filings from the IRS, adjusted to 2023 dollars using the Bureau of Labor Statistics’ Consumer Price Index.


Personal Finance
Visualizing the Tax Burden of Every U.S. State
Tax burden measures the percent of an individual’s income that is paid towards taxes. See where it’s the highest by state in this graphic.


Visualizing the Tax Burden of Every U.S. State
This was originally posted on our Voronoi app. Download the app for free on iOS or Android and discover incredible data-driven charts from a variety of trusted sources.
This map graphic visualizes the total tax burden in each U.S. state as of March 2024, based on figures compiled by WalletHub.
It’s important to understand that under this methodology, the tax burden measures the percent of an average person’s income that is paid towards state and local taxes. It considers property taxes, income taxes, and sales & excise tax.
Data and Methodology
The figures we used to create this graphic are listed in the table below.
| State | Total Tax Burden |
|---|---|
| New York | 12.0% |
| Hawaii | 11.8% |
| Vermont | 11.1% |
| Maine | 10.7% |
| California | 10.4% |
| Connecticut | 10.1% |
| Minnesota | 10.0% |
| Illinois | 9.7% |
| New Jersey | 9.5% |
| Rhode Island | 9.4% |
| Utah | 9.4% |
| Kansas | 9.3% |
| Maryland | 9.3% |
| Iowa | 9.2% |
| Nebraska | 9.2% |
| Ohio | 8.9% |
| Indiana | 8.9% |
| Arkansas | 8.8% |
| Mississippi | 8.8% |
| Massachusetts | 8.6% |
| Virginia | 8.5% |
| West Virginia | 8.5% |
| Oregon | 8.4% |
| Colorado | 8.4% |
| Pennsylvania | 8.4% |
| Wisconsin | 8.3% |
| Louisiana | 8.3% |
| Kentucky | 8.3% |
| Washington | 8.0% |
| New Mexico | 8.0% |
| Michigan | 8.0% |
| North Carolina | 7.9% |
| Idaho | 7.9% |
| Arizona | 7.8% |
| Missouri | 7.8% |
| Georgia | 7.7% |
| Texas | 7.6% |
| Alabama | 7.5% |
| Montana | 7.5% |
| South Carolina | 7.5% |
| Nevada | 7.4% |
| Oklahoma | 7.0% |
| North Dakota | 6.8% |
| South Dakota | 6.4% |
| Delaware | 6.4% |
| Tennessee | 6.1% |
| Florida | 6.1% |
| Wyoming | 5.7% |
| New Hampshire | 5.6% |
| Alaska | 4.9% |
From this data we can see that New York has the highest total tax burden. Residents in this state will pay, on average, 12% of their income to state and local governments.
Breaking this down into its three components, the average New Yorker pays 4.6% of their income on income taxes, 4.4% on property taxes, and 3% in sales & excise taxes.
At the other end of the spectrum, Alaska has the lowest tax burden of any state, equaling 4.9% of income. This is partly due to the fact that Alaskans do not pay state income tax.
Hate Paying Taxes?
In addition to Alaska, there are several other U.S. states that don’t charge income taxes. These are: Florida, Nevada, South Dakota, Tennessee, Texas, Washington, and Wyoming.
It’s also worth noting that New Hampshire does not have a regular income tax, but does charge a flat 4% on interest and dividend income according to the Tax Foundation.
Learn More About Taxation From Visual Capitalist
If you enjoyed this post, be sure to check out this graphic which ranks the countries with the lowest corporate tax rates, from 1980 to today.

-

 Personal Finance1 week ago
Visualizing the Tax Burden of Every U.S. State
-

 Misc6 days ago
Visualized: Aircraft Carriers by Country
-

 Culture6 days ago
How Popular Snack Brand Logos Have Changed
-

 Mining1 week ago
Visualizing Copper Production by Country in 2023
-

 Misc1 week ago
Charted: How Americans Feel About Federal Government Agencies
-

 Healthcare1 week ago
Which Countries Have the Highest Infant Mortality Rates?
-

 Demographics1 week ago
Mapped: U.S. Immigrants by Region
-

 Maps1 week ago
Mapped: Southeast Asia’s GDP Per Capita, by Country