Markets
Charted: The Dipping Cost of Shipping


The Dipping Cost of Shipping
A little over one year ago, congestion at America’s West Coast ports were making headlines, and the global cost of shipping containers had reached record highs.
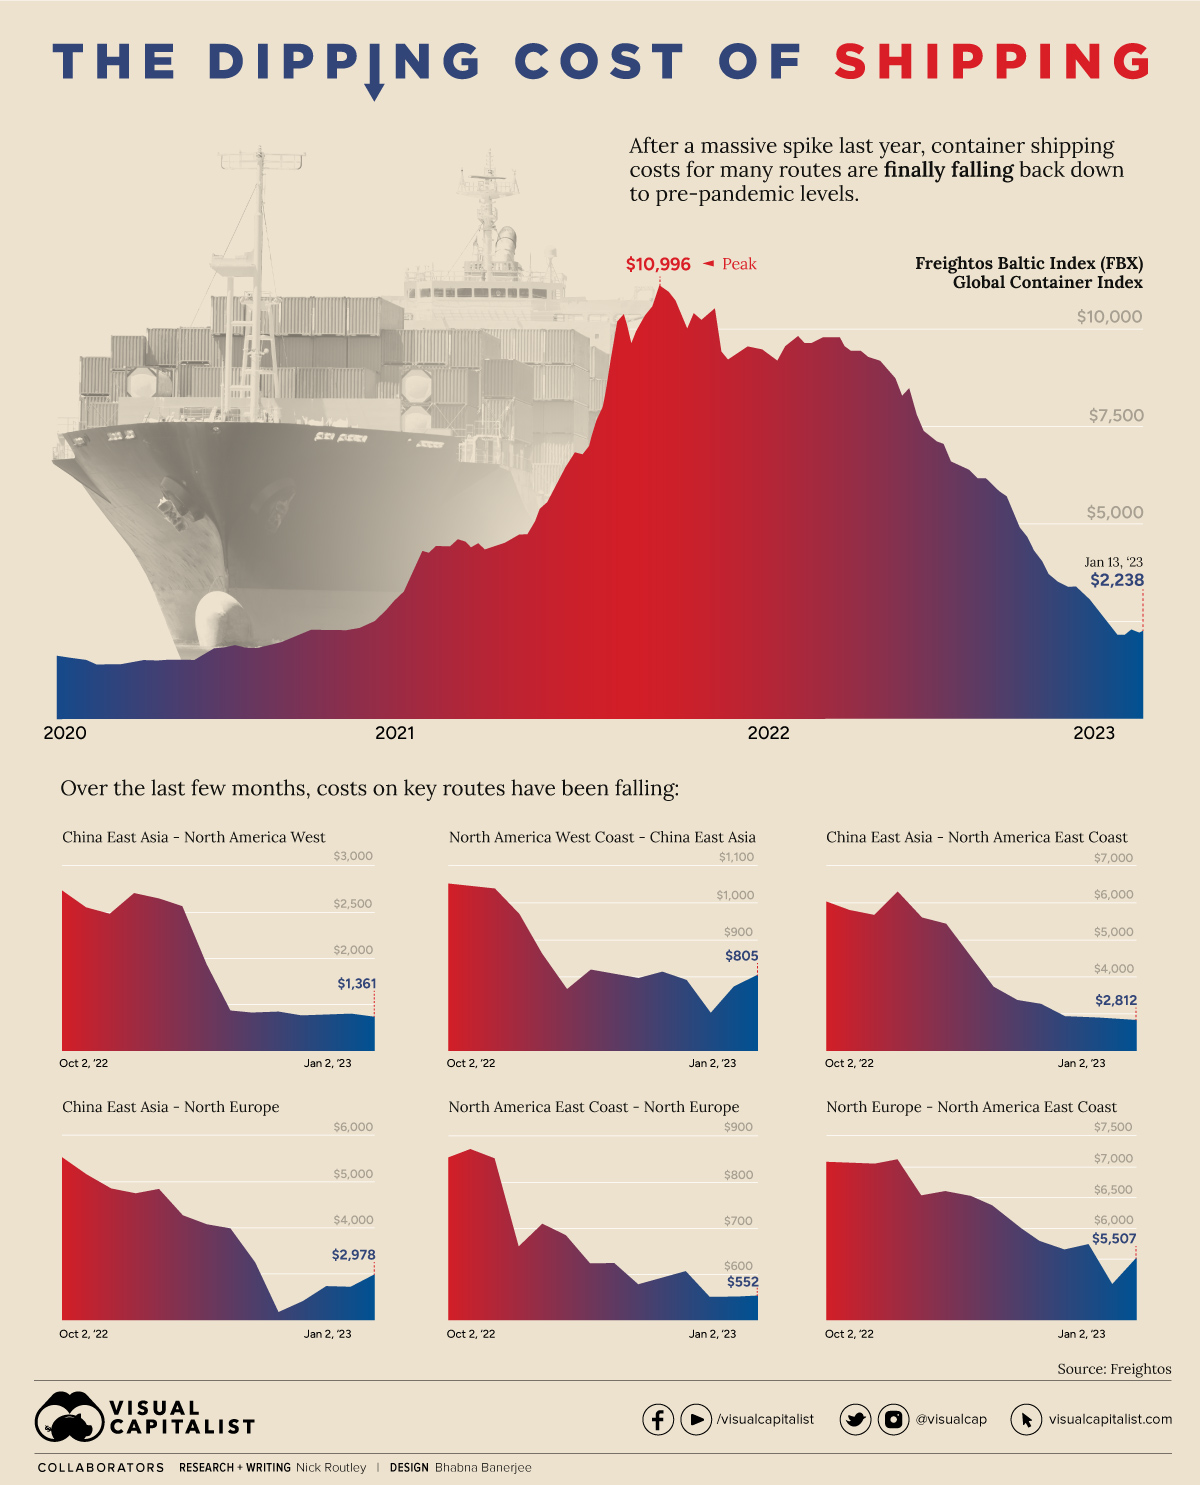
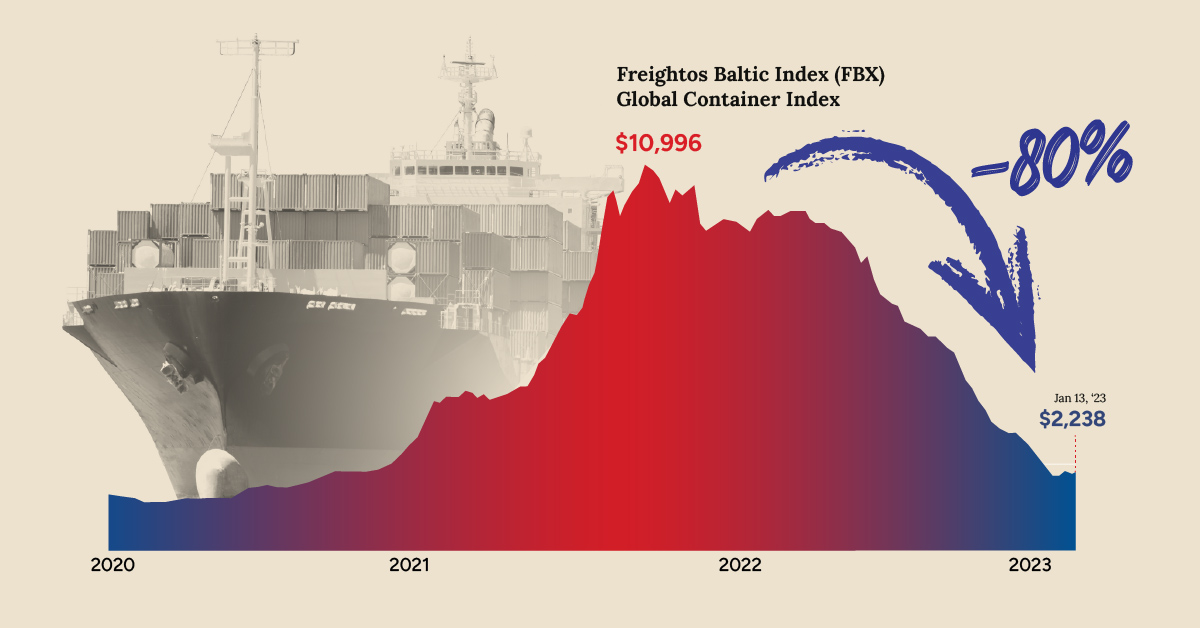
Today, shipping costs have come back down to Earth, with some routes approaching pre-pandemic levels. The graphic above, using data from Freightos, shows just how dramatically costs have fallen in a short amount of time.
The Freightos Baltic Index (FBX)—a widely recognized benchmark for global freight rates—has fallen 80% since its peak in late 2021.
| Shipping Route | Peak Price (Last 90 days) | Recent Price | Change |
|---|---|---|---|
| East Asia -> North America West | $2,702 | $1,323 | -51% |
| North America West -> East Asia | $1,037 | $805 | -22% |
| East Asia -> North America East | $6,296 | $2,812 | -55% |
| East Asia -> North Europe | $4,853 | $2,978 | -39% |
| North America East -> North Europe | $850 | $552 | -35% |
| North Europe -> North America East | $7,102 | $5,507 | -22% |
Why Shipping Costs Matter
The vast majority of trade is conducted over the world’s oceans, so skyrocketing shipping costs can wreak havoc on the global economy.
A recent study from the IMF, which included 143 countries over the past 30 years, found that shipping costs are an important driver of inflation around the world. In fact, when freight rates double, inflation increases by 0.7 of a percentage point.
Of course, some nations feel the effects of higher shipping costs more acutely than others. Countries that import more of what they consume and that are more integrated into the global supply chain are more likely to see inflation rise as shipping costs elevate.
Falling Freight Rates Are a Good Thing, Right?
Falling shipping costs are great news for everyone except, well…shippers.
While most of us can eventually look forward to improved supply chain efficiency and less inflationary pressure, shipping companies are seeing the end of a two-year boom period.
For example, major shippers like COSCO and Hapag-Lloyd saw a staggering 10x or more increase in profit per 20-foot equivalent unit (TEU) shipped.
For the time being, carriers are canceling voyages and sending obsolete ships to scrap to keep prices from bottoming out completely. In early January, container spot freight rates rose for first time in 43 weeks, signaling that the rollercoaster ride that shipping rates have been on since the start of the pandemic may be coming to an end.


Markets
Ranked: The World’s 50 Largest Private Equity Firms
In this graphic, we show the largest private equity firms in the world—from titan Blackstone to China’s leading alternative funds.
The World’s 50 Largest Private Equity Firms
This was originally posted on our Voronoi app. Download the app for free on iOS or Android and discover incredible data-driven charts from a variety of trusted sources.
In 2023, private equity firms controlled $8.2 trillion in assets globally according to McKinsey & Company, a figure that has rapidly expanded since the industry first emerged 40 years ago.
As large investors such as pension funds and insurance companies increasingly look to private markets, these alternative asset managers have seen their assets grow by more than twofold in the last five years.
This graphic shows the top 50 private equity firms worldwide, based on data from Private Equity International (PEI).
The Top 50 Private Equity Firms
To determine the rankings, private equity firms were defined as those that raise capital with the purpose of directly investing in businesses, covering diversified private equity, venture capital, growth equity, buyouts, along with turnaround or control-oriented distressed investment capital.
The ranking does not include funds of funds, private investment in public equity (PIPE), or funds that follow a secondaries, real estate, infrastructure, hedge fund, debt or mezzanine strategies.
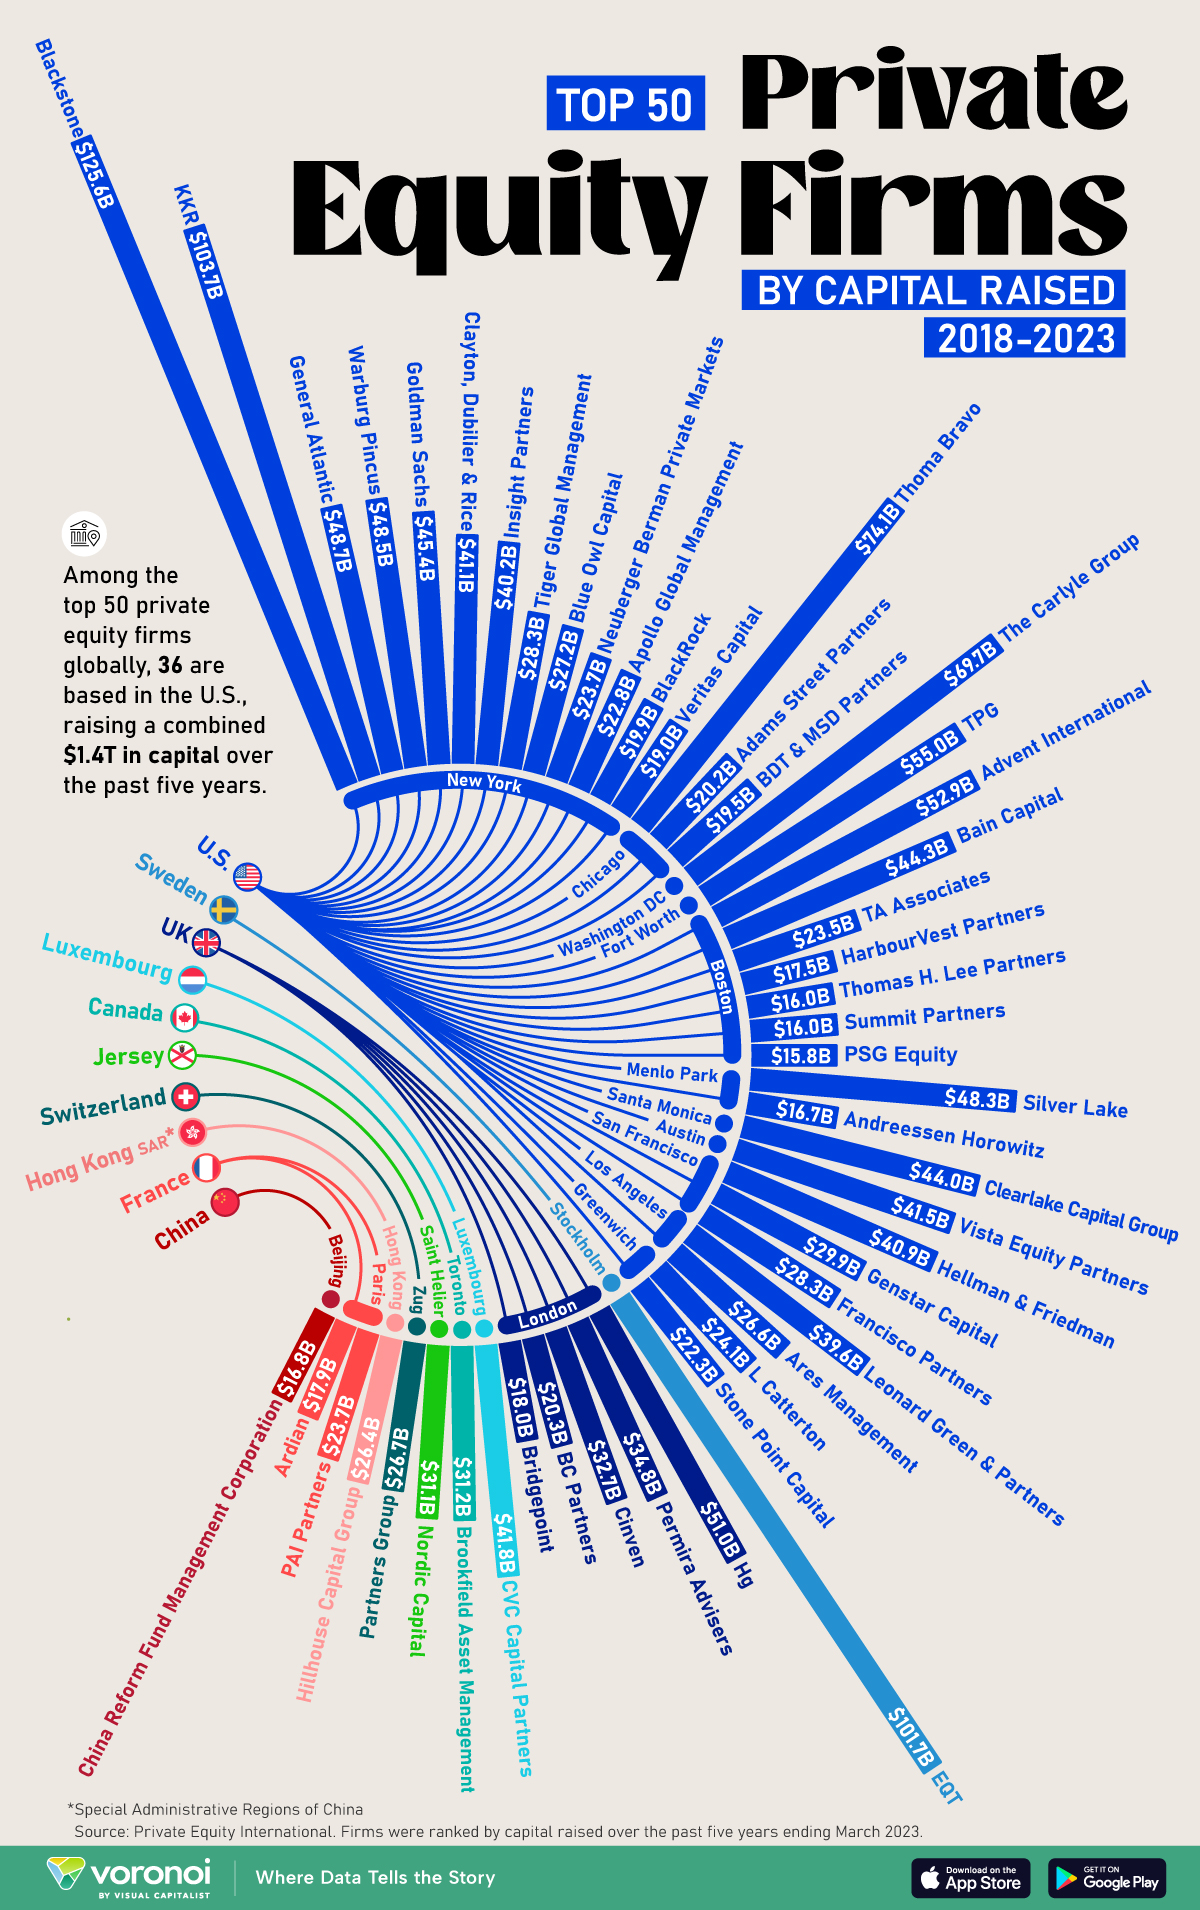
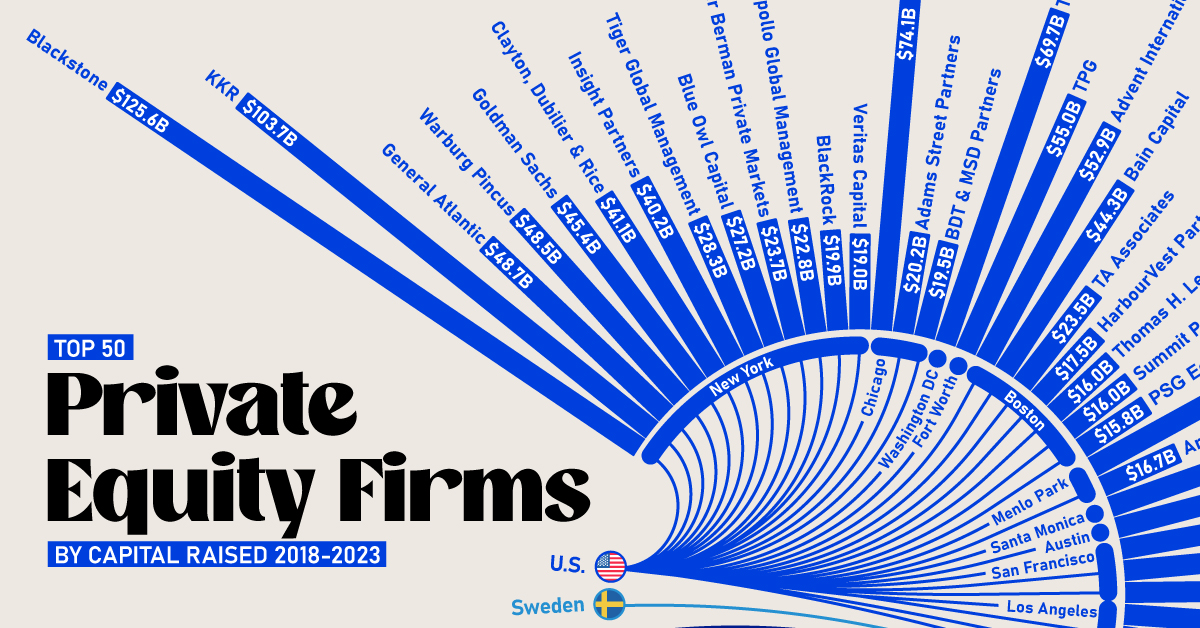
Below, we show the 50 biggest private equity companies around the world, measured by the scale of capital raised over the five-year period ending March 31, 2023:
| Ranking | Fund Manager | City | Capital Raised |
|---|---|---|---|
| 1 | Blackstone | New York | $125.6B |
| 2 | KKR | New York | $103.7B |
| 3 | EQT | Stockholm | $101.7B |
| 4 | Thoma Bravo | Chicago | $74.1B |
| 5 | The Carlyle Group | Washington DC | $69.7B |
| 6 | TPG | Fort Worth | $55.0B |
| 7 | Advent International | Boston | $52.9B |
| 8 | Hg | London | $51.0B |
| 9 | General Atlantic | New York | $48.7B |
| 10 | Warburg Pincus | New York | $48.5B |
| 11 | Silver Lake | Menlo Park | $48.3B |
| 12 | Goldman Sachs | New York | $45.4B |
| 13 | Bain Capital | Boston | $44.3B |
| 14 | Clearlake Capital Group | Santa Monica | $44.0B |
| 15 | CVC Capital Partners | Luxembourg | $41.8B |
| 16 | Vista Equity Partners | Austin | $41.5B |
| 17 | Clayton, Dubilier & Rice | New York | $41.1B |
| 18 | Hellman & Friedman | San Francisco | $40.9B |
| 19 | Insight Partners | New York | $40.2B |
| 20 | Leonard Green & Partners | Los Angeles | $39.6B |
| 21 | Permira Advisers | London | $34.8B |
| 22 | Cinven | London | $32.7B |
| 23 | Brookfield Asset Management | Toronto | $31.2B |
| 24 | Nordic Capital | Saint Helier | $31.1B |
| 25 | Genstar Capital | San Francisco | $29.9B |
| 26 | Francisco Partners | San Francisco | $28.3B |
| 27 | Tiger Global Management | New York | $28.3B |
| 28 | Blue Owl Capital | New York | $27.2B |
| 29 | Partners Group | Zug | $26.7B |
| 30 | Ares Management | Los Angeles | $26.6B |
| 31 | Hillhouse Capital Group | Hong Kong | $26.4B |
| 32 | L Catterton | Greenwich | $24.1B |
| 33 | Neuberger Berman Private Markets | New York | $23.7B |
| 34 | PAI Partners | Paris | $23.7B |
| 35 | TA Associates | Boston | $23.5B |
| 36 | Apollo Global Management | New York | $22.8B |
| 37 | Stone Point Capital | Greenwich | $22.3B |
| 38 | BC Partners | London | $20.3B |
| 39 | Adams Street Partners | Chicago | $20.2B |
| 40 | BlackRock | New York | $19.9B |
| 41 | BDT & MSD Partners | Chicago | $19.5B |
| 42 | Veritas Capital | New York | $19.0B |
| 43 | Bridgepoint | London | $18.0B |
| 44 | Ardian | Paris | $17.9B |
| 45 | HarbourVest Partners | Boston | $17.5B |
| 46 | China Reform Fund Management Corporation | Beijing | $16.8B |
| 47 | Andreessen Horowitz | Menlo Park | $16.7B |
| 48 | Thomas H. Lee Partners | Boston | $16.0B |
| 49 | Summit Partners | Boston | $16.0B |
| 50 | PSG Equity | Boston | $15.8B |
Private equity titan Blackstone is the top in the United States and the world, raising $125.6 billion in capital from 2018 to 2023.
Headquartered in New York, Blackstone’s total assets under management stood at $991 billion as of the first quarter of 2023, and have since surpassed $1 trillion this year. For perspective, this is comparable to the GDP of the Netherlands.
Following next in line are KKR and Sweden’s EQT, each raising over $100 billion. In fact, this was the first time three firms achieved this $100 billion equity-raise milestone in PEI’s ranking over a five-year period. This was particularly notable given a challenging fundraising landscape amid higher borrowing costs and lagging dealmaking activity.
North American Firms Dominate Private Equity
As we can see, the vast majority of the biggest private equity firms are based in America, accounting for 36 of the top 50 firms globally. North American PE firms made up $1.34 trillion (72%) of the $1.85 trillion raised by the top 50 firms in the ranking.
Falling in second by a wide margin is Europe, with nine firms making up $179 billion (9.7%) of the total funds raised. Many of Europe’s largest private equity firms are based in London, England, with the most prominent asset managers in the city being Hg and Permira Advisors.
Across Asia, the top alternative investment firm was Hong Kong-based Hillhouse Capital Group, which launched in 2005. The firm has backed several internet companies spanning from Tencent, the largest publicly-traded company in China, to Baidu, but has faced increasing setbacks amid regulatory crackdowns and a sluggish Chinese stock market.

-

 Healthcare7 days ago
Which Countries Have the Highest Infant Mortality Rates?
-

 Misc2 weeks ago
The Evolution of U.S. Beer Logos
-

 Healthcare2 weeks ago
What Causes Preventable Child Deaths?
-

 Energy2 weeks ago
Who’s Building the Most Solar Energy?
-

 Markets1 week ago
Mapped: The Most Valuable Company in Each Southeast Asian Country
-

 Technology1 week ago
Mapped: The Number of AI Startups By Country
-

 Healthcare1 week ago
Life Expectancy by Region (1950-2050F)
-

 Stocks1 week ago
The Growth of a $1,000 Equity Investment, by Stock Market