United States
China’s Growing Trade Dominance in Latin America
Article/Editing:
China’s Growing Trade Dominance in Latin America
Over the past 20 years, China’s economic presence around the world has grown significantly, including in Latin America.
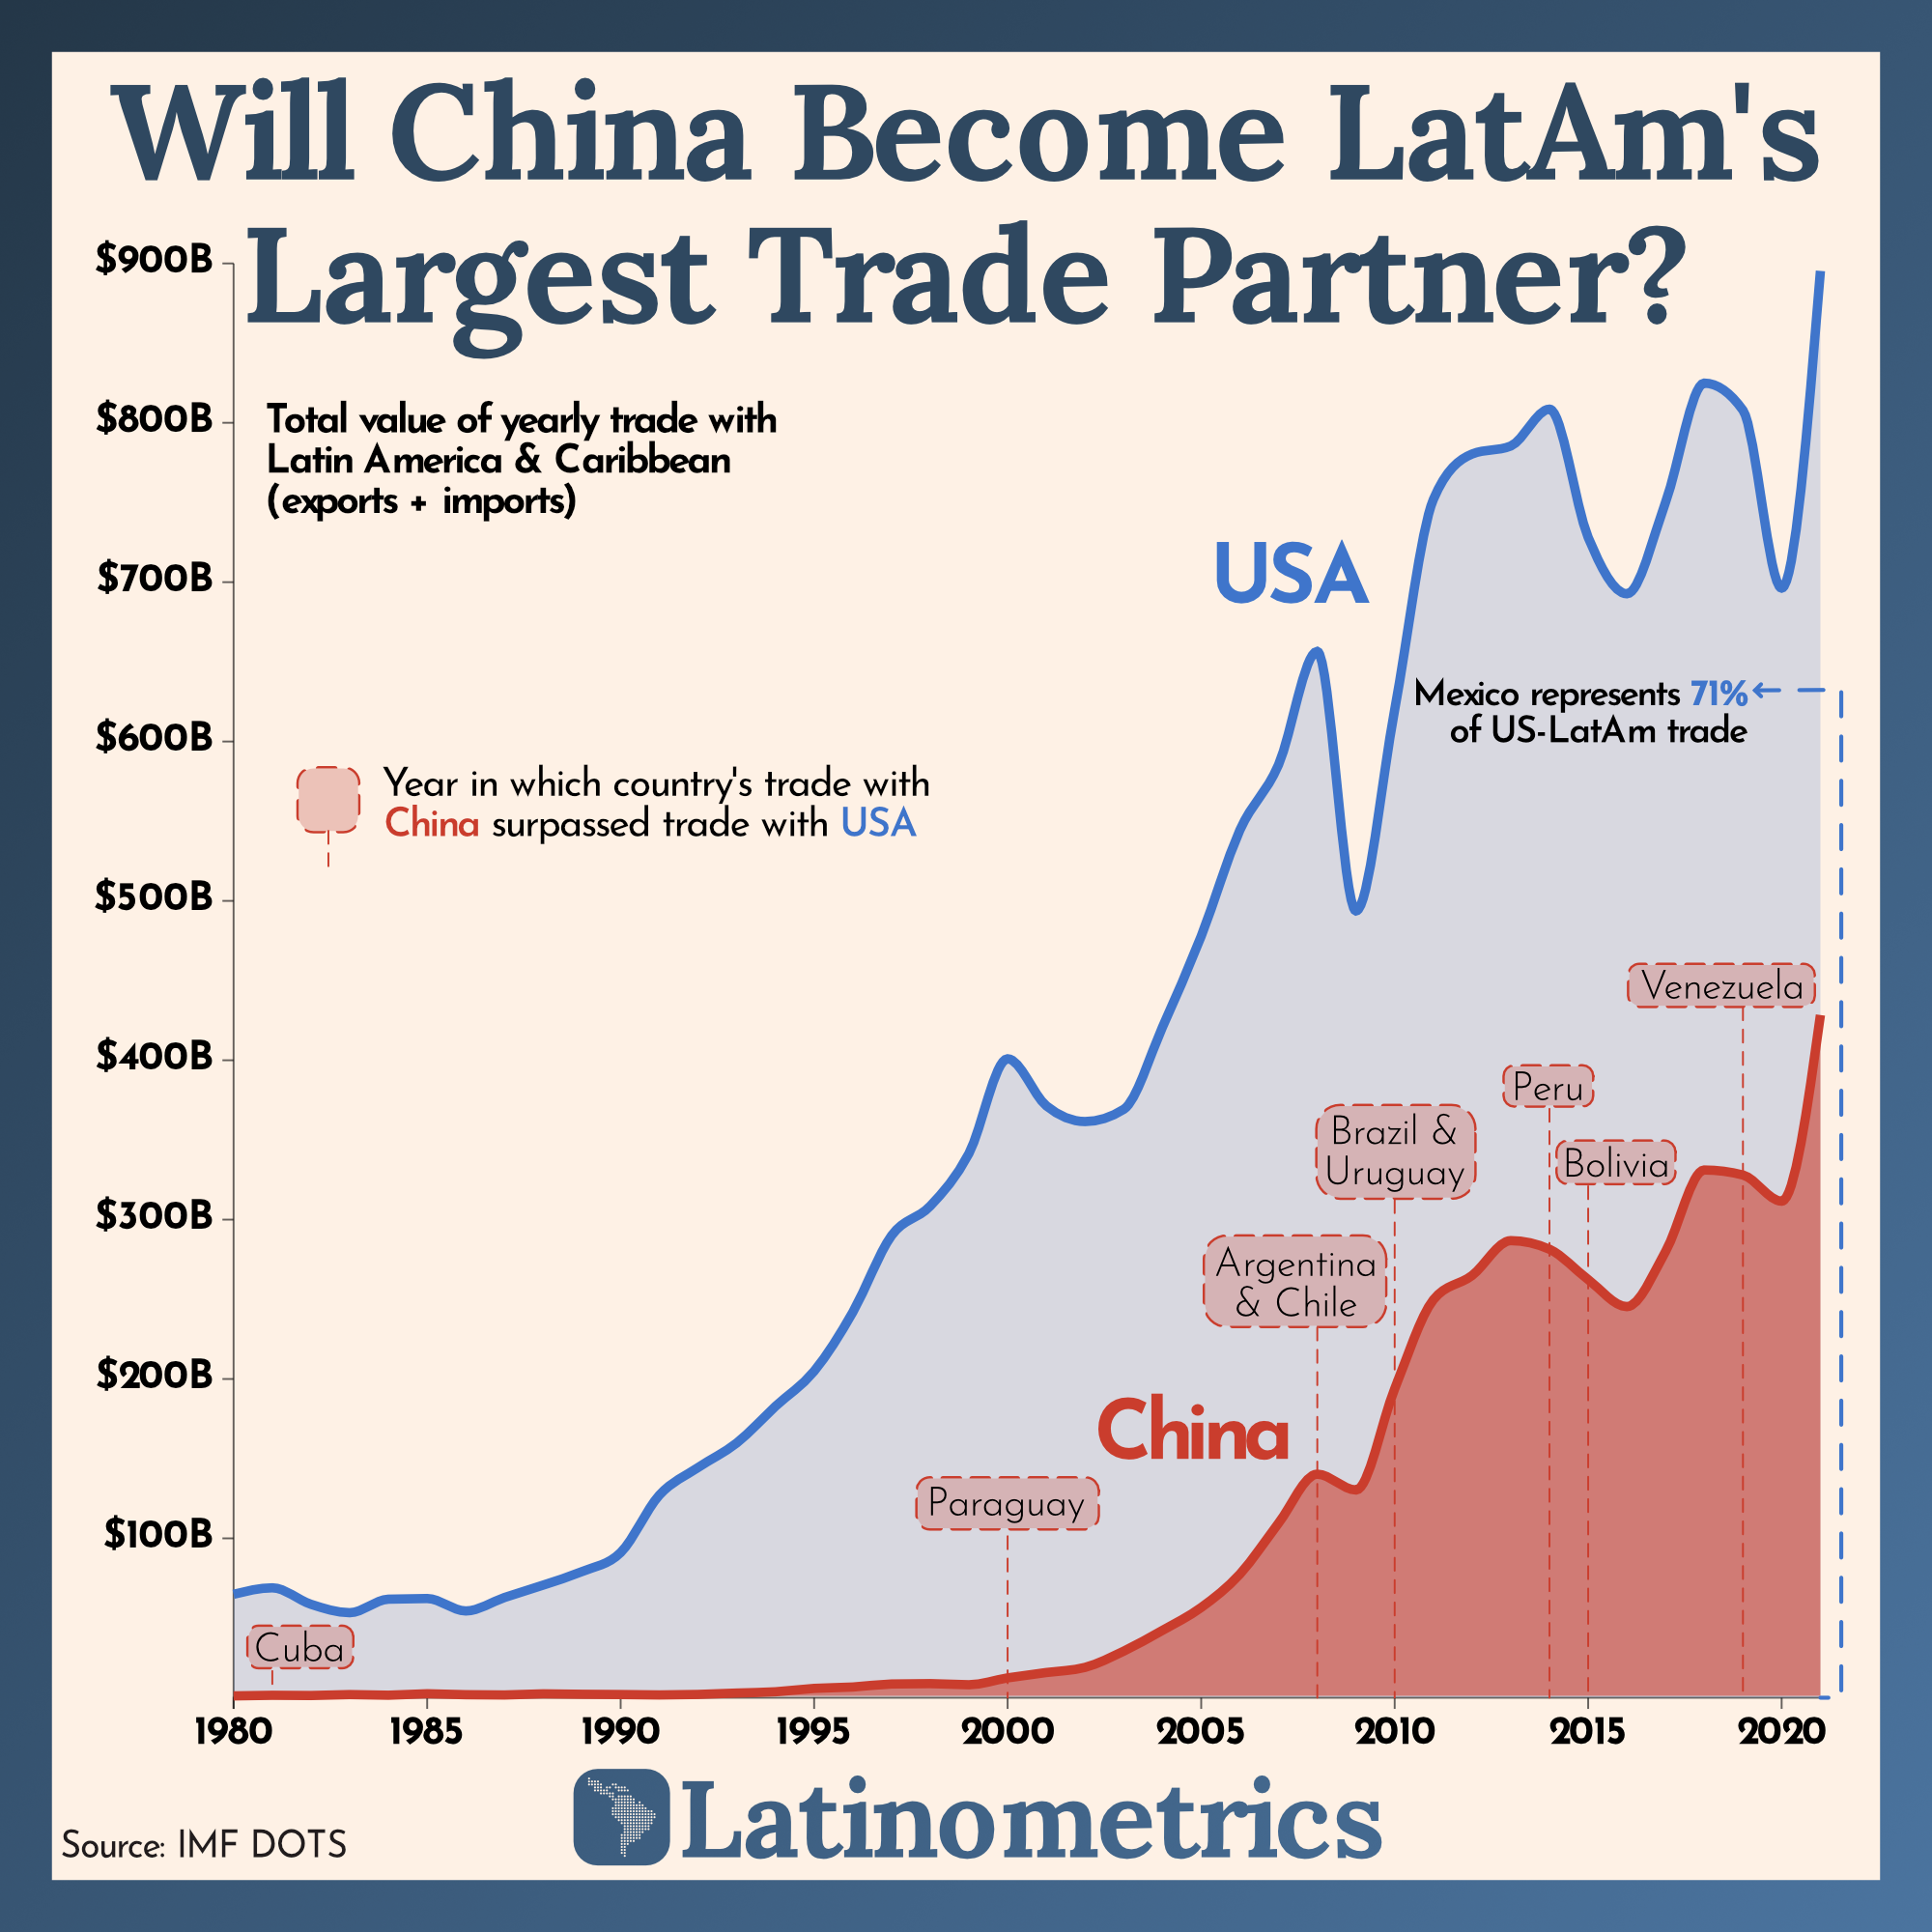
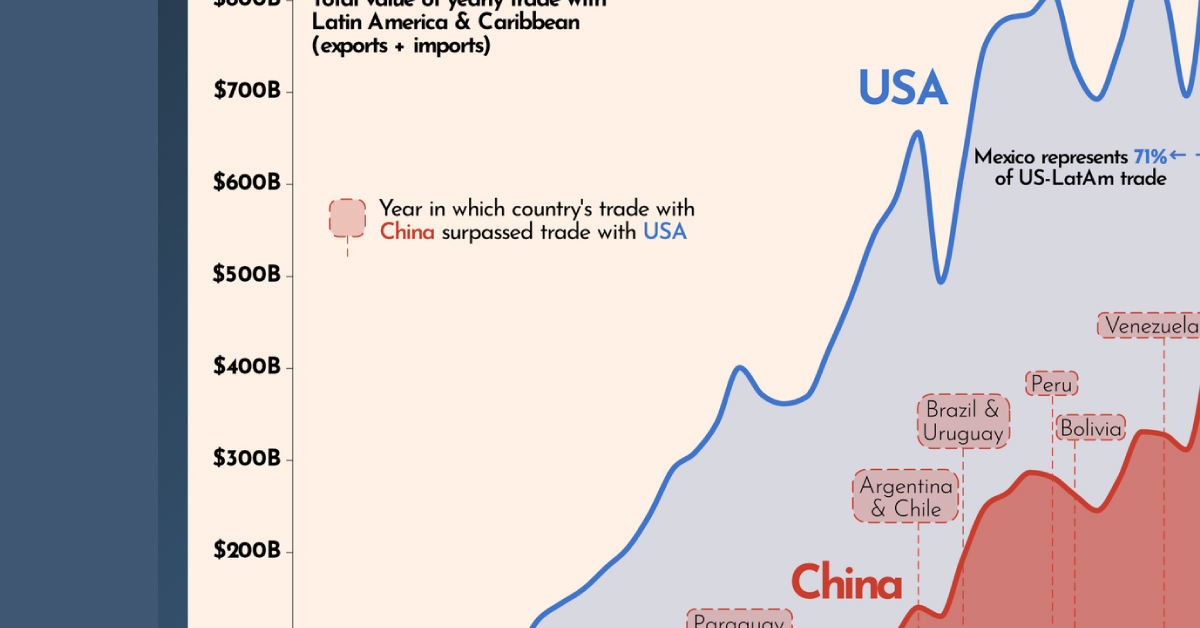
Now, China is one of Latin America’s largest trade partners, which is threatening U.S. dominance in the region. This graphic by Latinometrics uses IMF data to show trade flows between China and Latin America since the 1980s.
Two Decades of Trade Growth
Four decades ago, the United States had a much stronger trade relationship with Latin America than China did. In 1981, Cuba was the only Latin American country trading more with China than the United States.
Here’s a look at total trade flows between Latin America and the two countries since 1980. Latinometrics calculated trade flows as total exports plus imports.
| Trade Flows by Year | U.S. & Latin America | China & Latin America |
|---|---|---|
| 1980 | $64,916.46M | $1,149.20M |
| 1981 | $68,954.16M | $1,524.78M |
| 1982 | $58,601.14M | $1,381.61M |
| 1983 | $53,347.45M | $1,973.34M |
| 1984 | $61,829.84M | $1,573.58M |
| 1985 | $62,241.61M | $2,489.73M |
| 1986 | $54,441.85M | $1,888.88M |
| 1987 | $62,890.00M | $1,721.23M |
| 1988 | $70,673.07M | $2,433.94M |
| 1989 | $79,140.76M | $2,149.71M |
| 1990 | $91,090.09M | $1,997.48M |
| 1991 | $127,120.71M | $1,741.68M |
| 1992 | $144,422.66M | $2,051.77M |
| 1993 | $159,873.67M | $2,923.49M |
| 1994 | $182,872.71M | $3,724.97M |
| 1995 | $204,901.92M | $5,847.65M |
| 1996 | $241,927.58M | $6,711.47M |
| 1997 | $290,032.40M | $8,609.87M |
| 1998 | $308,555.72M | $8,844.21M |
| 1999 | $341,504.58M | $8,138.22M |
| 2000 | $400,901.25M | $12,452.97M |
| 2001 | $371,377.08M | $15,818.76M |
| 2002 | $361,536.31M | $19,033.47M |
| 2003 | $369,218.54M | $29,215.64M |
| 2004 | $420,744.88M | $42,242.20M |
| 2005 | $477,850.02M | $56,609.70M |
| 2006 | $544,418.91M | $77,528.04M |
| 2007 | $585,446.96M | $109,558.66M |
| 2008 | $656,499.37M | $140,274.87M |
| 2009 | $493,741.65M | $130,359.64M |
| 2010 | $619,989.84M | $193,853.31M |
| 2011 | $751,891.79M | $249,708.91M |
| 2012 | $780,401.27M | $264,908.73M |
| 2013 | $785,444.16M | $286,816.10M |
| 2014 | $808,542.96M | $281,412.70M |
| 2015 | $728,071.40M | $262,383.97M |
| 2016 | $692,719.56M | $245,403.45M |
| 2017 | $750,289.25M | $280,072.19M |
| 2018 | $824,877.82M | $331,131.25M |
| 2019 | $807,868.87M | $327,999.75M |
| 2020 | $696,294.90M | $311,584.87M |
| 2021 | $895,309.53M | $428,384.92M |
Things stayed relatively stagnant until the early 2000s. Then suddenly, at the start of the new millennium, trade between China and Latin America started to ramp up.
This uptick was driven largely by Chinese demand for things like copper, oil, and other raw materials that the country needed to help fuel its industrial revolution.
Momentum has continued for two decades, and now China is the top trading partner in nine different Latin American countries. In fact, in 2021, imports and exports between China and Latin America (excluding Mexico) reached $247 billion—that’s $73 billion more than trade flows with the United States that same year.
Trade between China and Latin America is expected to keep growing, at least for the time being. By 2035, trade flows between the two regions are projected to more than double, according to World Economic Forum.
China’s Global Economic Presence
China’s trade takeover of Latin America speaks to a wider trend that’s happening on a global scale—over the last two decades, China has surpassed the U.S. as the world’s largest trading partner.
While China is likely to remain the world’s leading trade partner for the foreseeable future, growth is likely to slow in the short-term, given ongoing supply chain issues and geopolitical tensions that have disrupted the global economy.

This article was published as a part of Visual Capitalist's Creator Program, which features data-driven visuals from some of our favorite Creators around the world.


Misc
The Top 25 Nationalities of U.S. Immigrants
Mexico is the largest source of immigrants to the U.S., with almost 11 million immigrants.


The Top 25 Nationalities of U.S. Immigrants
This was originally posted on our Voronoi app. Download the app for free on iOS or Android and discover incredible data-driven charts from a variety of trusted sources.
The United States is home to more than 46 million immigrants, constituting approximately 14% of its total population.
This graphic displays the top 25 countries of origin for U.S. immigrants, based on 2022 estimates. The data is sourced from the Migration Policy Institute (MPI), which analyzed information from the U.S. Census Bureau’s 2022 American Community Survey.
In this context, “immigrants” refer to individuals residing in the United States who were not U.S. citizens at birth.
Mexico Emerges as a Leading Source of Immigration
Mexico stands out as the largest contributor to U.S. immigration due to its geographical proximity and historical ties.
Various economic factors, including wage disparities and employment opportunities, motivate many Mexicans to seek better prospects north of the border.
| Country | Region | # of Immigrants |
|---|---|---|
| 🇲🇽 Mexico | Latin America & Caribbean | 10,678,502 |
| 🇮🇳 India | Asia | 2,839,618 |
| 🇨🇳 China | Asia | 2,217,894 |
| 🇵🇭 Philippines | Asia | 1,982,333 |
| 🇸🇻 El Salvador | Latin America & Caribbean | 1,407,622 |
| 🇻🇳 Vietnam | Asia | 1,331,192 |
| 🇨🇺 Cuba | Latin America & Caribbean | 1,312,510 |
| 🇩🇴 Dominican Republic | Latin America & Caribbean | 1,279,900 |
| 🇬🇹 Guatemala | Latin America & Caribbean | 1,148,543 |
| 🇰🇷 Korea | Asia | 1,045,100 |
| 🇨🇴 Colombia | Latin America & Caribbean | 928,053 |
| 🇭🇳 Honduras | Latin America & Caribbean | 843,774 |
| 🇨🇦 Canada | Northern America | 821,322 |
| 🇯🇲 Jamaica | Latin America & Caribbean | 804,775 |
| 🇭🇹 Haiti | Latin America & Caribbean | 730,780 |
| 🇬🇧 United Kingdom | Europe | 676,652 |
| 🇻🇪 Venezuela | Latin America & Caribbean | 667,664 |
| 🇧🇷 Brazil | Latin America & Caribbean | 618,525 |
| 🇩🇪 Germany | Europe | 537,484 |
| 🇪🇨 Ecuador | Latin America & Caribbean | 518,287 |
| 🇵🇪 Peru | Latin America & Caribbean | 471,988 |
| 🇳🇬 Nigeria | Africa | 448,405 |
| 🇺🇦 Ukraine | Europe | 427,163 |
| 🇮🇷 Iran | Middle East | 407,283 |
| 🇵🇰 Pakistan | Asia | 399,086 |
| Rest of World | 11,637,634 | |
| Total | 46,182,089 |
Mexicans are followed in this ranking by Indians, Chinese, and Filipinos, though most immigrants on this list come from countries in the Latin American and Caribbean region.
On the other hand, only three European countries are among the top sources of U.S. immigrants: the UK, Germany, and Ukraine.
Immigration continues to be a significant factor contributing to the overall growth of the U.S. population. Overall population growth has decelerated over the past decade primarily due to declining birth rates.
Between 2021 and 2022, the increase in the immigrant population accounted for 65% of the total population growth in the U.S., representing 912,000 individuals out of nearly 1.4 million.
If you enjoyed this post, be sure to check out Visualized: Why Do People Immigrate to the U.S.? This visualization shows the different reasons cited by new arrivals to America in 2021.

-

 Personal Finance1 week ago
Visualizing the Tax Burden of Every U.S. State
-

 Misc6 days ago
Visualized: Aircraft Carriers by Country
-

 Culture6 days ago
How Popular Snack Brand Logos Have Changed
-

 Mining1 week ago
Visualizing Copper Production by Country in 2023
-

 Misc1 week ago
Charted: How Americans Feel About Federal Government Agencies
-

 Healthcare1 week ago
Which Countries Have the Highest Infant Mortality Rates?
-

 Demographics1 week ago
Mapped: U.S. Immigrants by Region
-

 Maps1 week ago
Mapped: Southeast Asia’s GDP Per Capita, by Country