Energy
Ranked: Countries with the Most Sustainable Energy Policies
Ranked: Countries With Most Sustainable Energy Policies
The sourcing and distribution of energy is one of the most pressing issues of our time.
Just under one billion people still lack basic access to electricity, and many more connect to the grid through improvised wiring or live through frequent blackouts. On the flip side of the socioeconomic spectrum, a growing chorus of voices is pressuring governments and corporations to power the global economy in a more sustainable way.
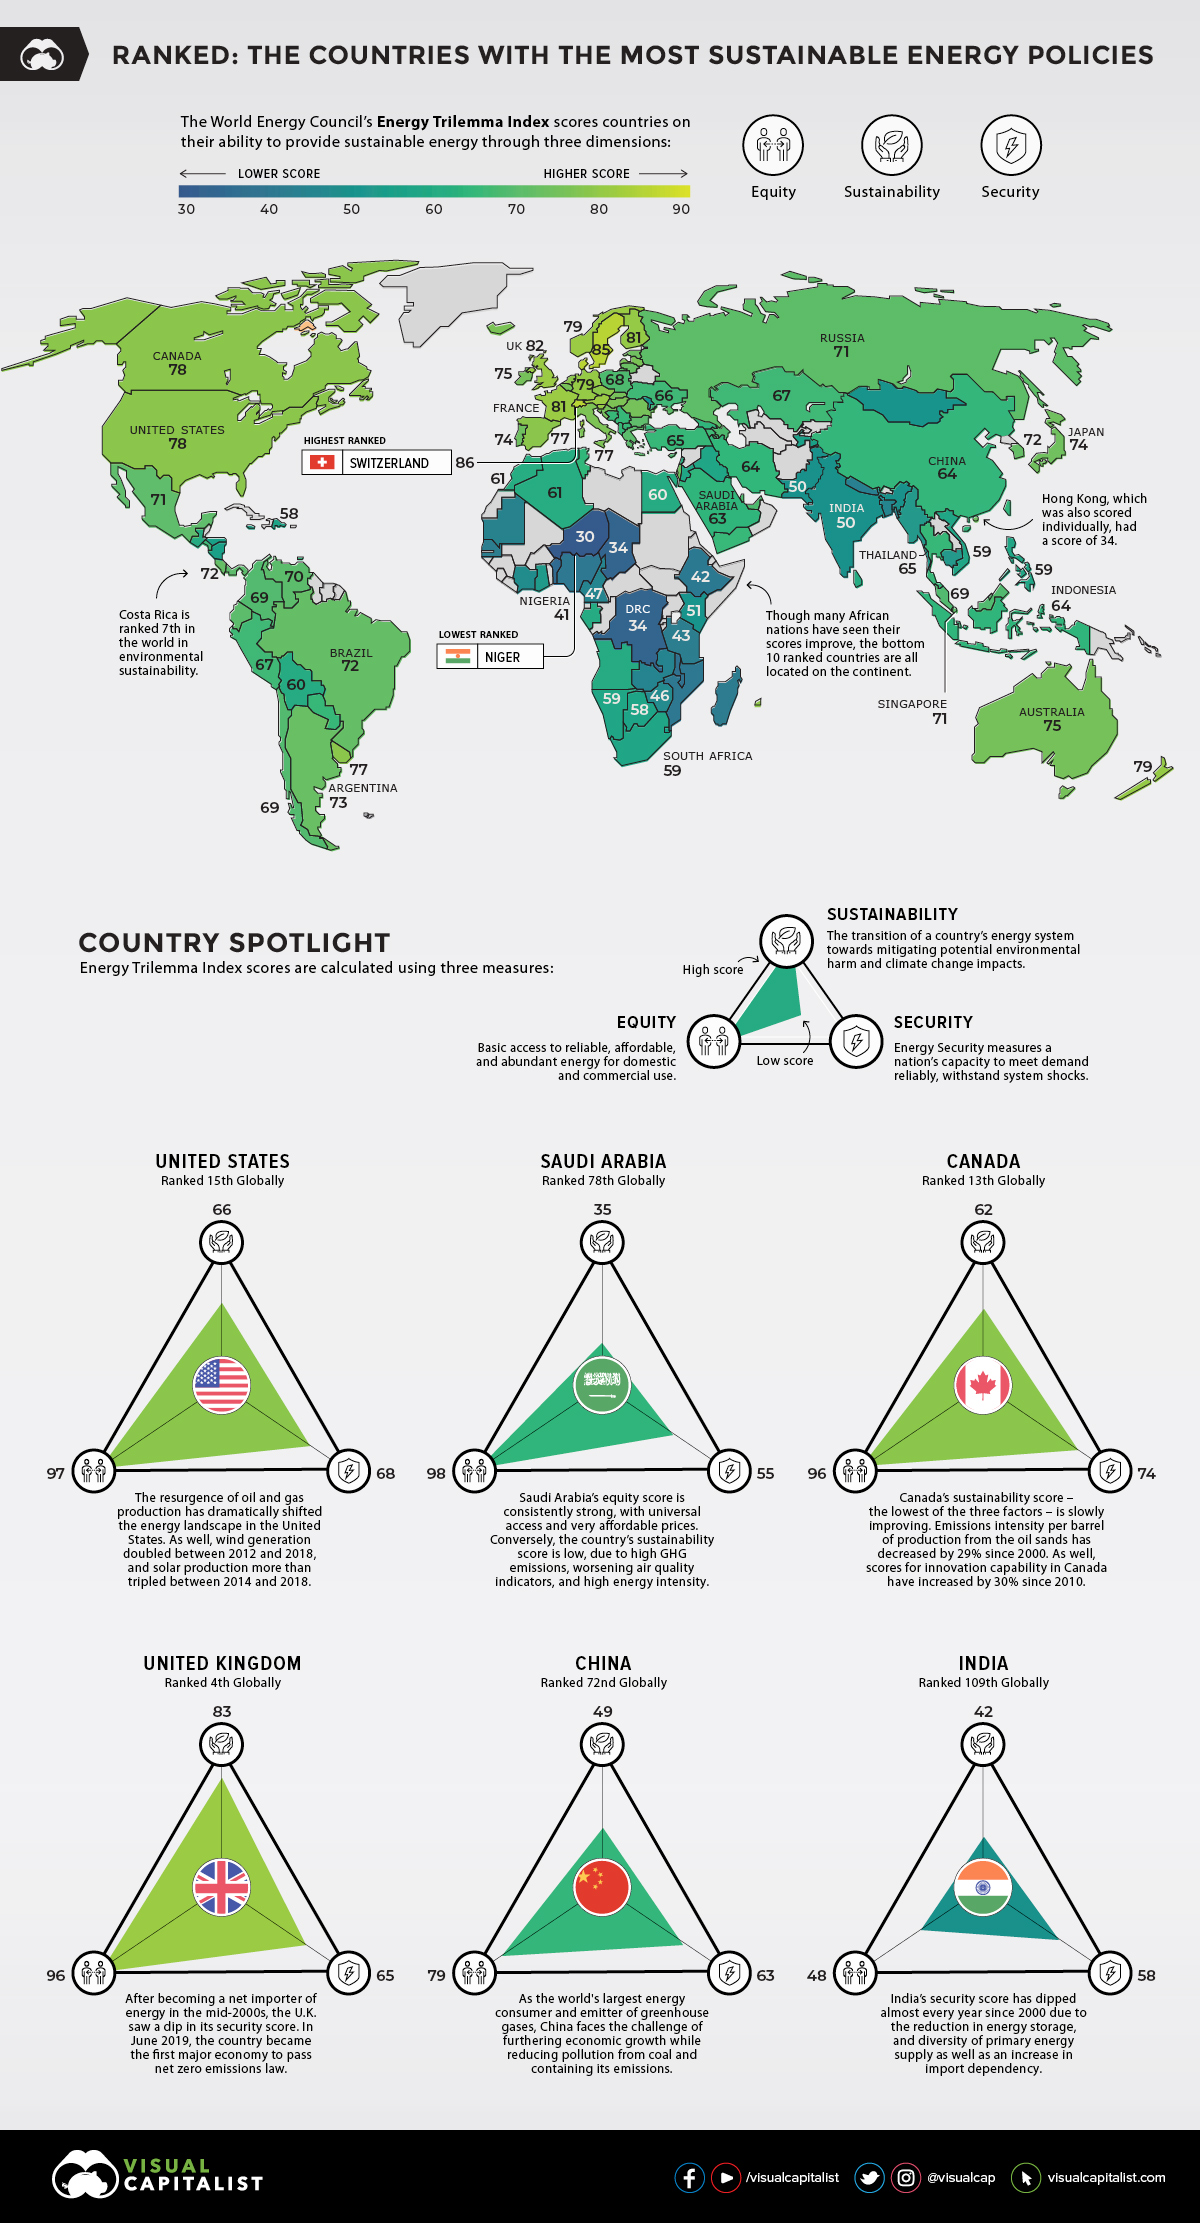
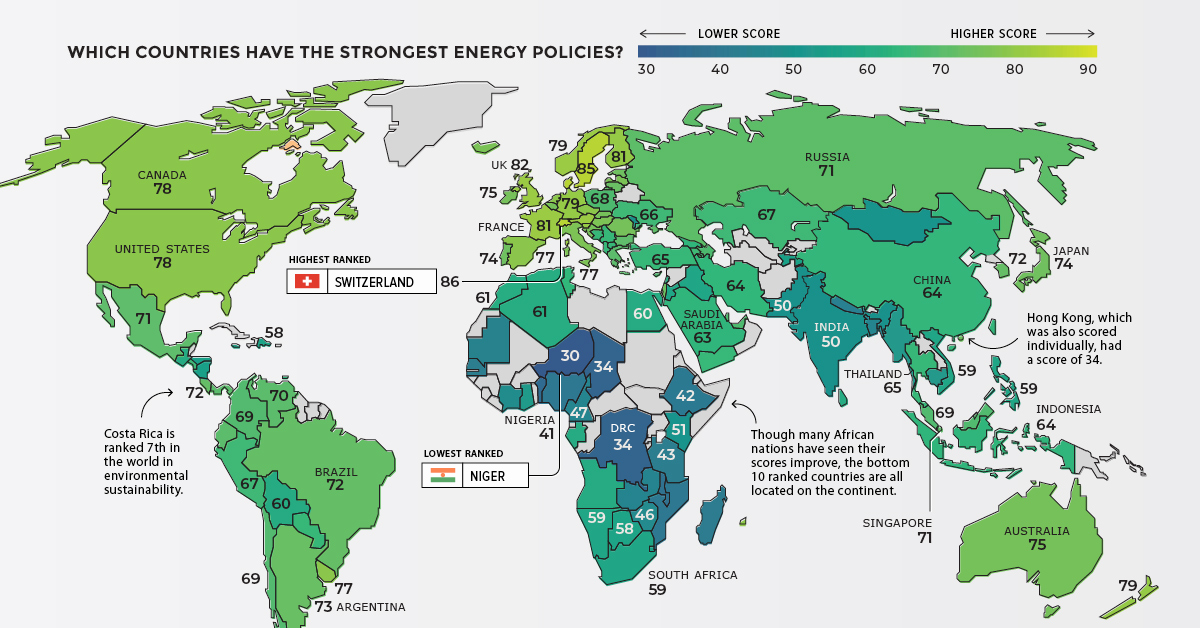
Today’s visualization – using data from the World Energy Council (WEC) – ranks countries based on their mix of policies for tackling issues like energy security and environmental sustainability.
The Energy Trilemma Index
According to WEC, there are three primary policy areas that form the “trilemma”:
1. Energy Security
A nation’s capacity to meet current and future energy demand reliably, and bounce back swiftly from system shocks with minimal disruption to supply. This dimension covers the effectiveness of management of domestic and external energy sources, as well as the reliability and resilience of energy infrastructure.
2. Energy Equity
A country’s ability to provide universal access to reliable, affordable, and abundant energy for domestic and commercial use. This dimension captures basic access to electricity and clean cooking fuels and technologies, access to prosperity-enabling levels of energy consumption, and affordability of electricity, gas, and fuel.
3. Environmental Sustainability
The transition of a country’s energy system towards mitigating and avoiding environmental harm and climate change impacts. This dimension focuses on productivity and efficiency of generation, transmission and distribution, decarbonization, and air quality.
Using the dimensions above, a score out of 100 is generated. Here’s a complete ranking that shows which countries have the most sustainable energy policies:
| Rank | Country | Trilemma Score | Letter Grade* |
|---|---|---|---|
| 1 | 🇨🇭 Switzerland | 85.8 | AAA |
| 2 | 🇸🇪 Sweden | 85.2 | AAA |
| 3 | 🇩🇰 Denmark | 84.7 | AAA |
| 4 | 🇬🇧 United Kingdom | 81.5 | AAA |
| 5 | 🇫🇮 Finland | 81.1 | AAA |
| 6 | 🇫🇷 France | 80.8 | AAA |
| 7 | 🇦🇹 Austria | 80.7 | AAA |
| 8 | 🇱🇺 Luxembourg | 80.4 | BAA |
| 9 | 🇩🇪 Germany | 79.4 | AAA |
| 10 | 🇳🇿 New Zealand | 79.4 | AAA |
| 11 | 🇳🇴 Norway | 79.3 | CAA |
| 12 | 🇸🇮 Slovenia | 79.2 | AAA |
| 13 | 🇨🇦 Canada | 78.0 | AAC |
| 14 | 🇳🇱 Netherlands | 77.8 | BAB |
| 15 | 🇺🇸 United States | 77.5 | AAB |
| 16 | 🇨🇿 Czech Republic | 77.4 | AAB |
| 17 | 🇺🇾 Uruguay | 77.2 | ABA |
| 18 | 🇪🇸 Spain | 77.0 | BAA |
| 19 | 🇭🇺 Hungary | 76.8 | AAB |
| 20 | 🇮🇹 Italy | 76.8 | BAA |
| 21 | 🇮🇸 Iceland | 76.2 | BAB |
| 22 | 🇱🇻 Latvia | 76.1 | ABA |
| 23 | 🇸🇰 Slovakia | 75.6 | ABA |
| 24 | 🇧🇪 Belgium | 75.2 | BAA |
| 25 | 🇮🇪 Ireland | 75.2 | CAA |
| 26 | 🇷🇴 Romania | 75.1 | ABA |
| 27 | 🇭🇷 Croatia | 74.9 | ABA |
| 28 | 🇦🇺 Australia | 74.7 | BAB |
| 29 | 🇵🇹 Portugal | 74.0 | BBB |
| 30 | 🇪🇪 Estonia | 73.8 | BAB |
| 31 | 🇯🇵 Japan | 73.8 | CAB |
| 32 | 🇮🇱 Israel | 73.3 | CAB |
| 33 | 🇲🇹 Malta | 72.9 | DAA |
| 34 | 🇭🇰 Hong Kong (China) | 72.5 | DAB |
| 35 | 🇦🇷 Argentina | 72.4 | BAB |
| 36 | 🇱🇹 Lithuania | 72.4 | CBA |
| 37 | 🇰🇷 South Korea | 71.7 | BAC |
| 38 | 🇨🇷 Costa Rica | 71.6 | CBA |
| 39 | 🇧🇷 Brazil | 71.6 | ABA |
| 40 | 🇲🇽 Mexico | 71.3 | ABB |
| 41 | 🇧🇬 Bulgaria | 71.3 | BBB |
| 42 | 🇷🇺 Russia | 71.2 | AAC |
| 43 | 🇸🇬 Singapore | 71.2 | DAB |
| 44 | 🇻🇪 Venezuela | 70.3 | ABB |
| 45 | 🇪🇨 Ecuador | 69.6 | ABB |
| 46 | 🇵🇦 Panama | 69.5 | CBA |
| 47 | 🇬🇷 Greece | 69.5 | CBA |
| 48 | 🇨🇱 Chile | 69.4 | BBB |
| 49 | 🇨🇴 Colombia | 69.3 | BCA |
| 50 | 🇲🇺 Mauritius | 69.0 | CBB |
| 51 | 🇲🇾 Malaysia | 68.5 | BBC |
| 52 | 🇦🇪 U.A.E. | 68.3 | BAD |
| 53 | 🇵🇱 Poland | 68.3 | BBB |
| 54 | 🇨🇾 Cyprus | 67.9 | DBB |
| 55 | 🇶🇦 Qatar | 67.9 | AAD |
| 56 | 🇧🇳 Brunei | 67.7 | CBC |
| 57 | 🇦🇿 Azerbaijan | 67.7 | BBB |
| 58 | 🇵🇪 Peru | 66.8 | ACB |
| 59 | 🇰🇿 Kazakhstan | 66.6 | BBC |
| 60 | 🇦🇲 Armenia | 66.3 | CBB |
| 61 | 🇺🇦 Ukraine | 66.0 | ACC |
| 62 | 🇸🇻 El Salvador | 66.0 | BCA |
| 63 | 🇴🇲 Oman | 65.5 | BAD |
| 64 | 🇲🇪 Montenegro | 65.4 | CBB |
| 65 | 🇰🇼 Kuwait | 65.2 | CAD |
| 66 | 🇹🇷 Turkey | 64.9 | CBC |
| 67 | 🇵🇾 Paraguay | 64.7 | DBA |
| 68 | 🇹🇭 Thailand | 64.6 | CBC |
| 69 | 🇮🇩 Indonesia | 64.1 | BCC |
| 70 | 🇷🇸 Serbia | 63.8 | BBC |
| 71 | 🇲🇰 North Macedonia | 63.7 | CBC |
| 72 | 🇨🇳 China | 63.7 | BBD |
| 73 | 🇦🇱 Albania | 63.7 | DBA |
| 74 | 🇮🇷 Iran | 63.6 | ABD |
| 75 | 🇹🇳 Tunisia | 63.6 | BBC |
| 76 | 🇹🇹 Trinidad and Tobago | 63.3 | CAD |
| 77 | 🇬🇪 Georgia | 63.1 | CBC |
| 78 | 🇸🇦 Saudi Arabia | 62.8 | CAD |
| 79 | 🇧🇦 Bosnia and Herz. | 62.1 | BBC |
| 80 | 🇧🇭 Bahrain | 62.1 | BAD |
| 81 | 🇱🇧 Lebanon | 61.6 | DAC |
| 82 | 🇩🇿 Algeria | 61.3 | CBD |
| 83 | 🇲🇦 Morocco | 61.1 | CCC |
| 84 | 🇧🇴 Bolivia | 60.4 | BCC |
| 85 | 🇱🇰 Sri Lanka | 60.1 | BCB |
| 86 | 🇦🇴 Angola | 60.0 | ADB |
| 87 | 🇪🇬 Egypt | 59.9 | BBD |
| 88 | 🇬🇹 Guatemala | 59.7 | BCC |
| 89 | 🇬🇦 Gabon | 59.5 | CBD |
| 90 | 🇳🇦 Namibia | 59.1 | CDA |
| 91 | 🇻🇳 Vietnam | 58.9 | ACD |
| 92 | 🇿🇦 South Africa | 58.9 | DBD |
| 93 | 🇮🇶 Iraq | 58.9 | BBD |
| 94 | 🇵🇭 Philippines | 58.6 | BCC |
| 95 | 🇯🇴 Jordan | 58.5 | DBC |
| 96 | 🇧🇼 Botswana | 57.7 | DCC |
| 97 | 🇩🇴 Dominican Republic | 57.6 | DBB |
| 98 | 🇯🇲 Jamaica | 56.9 | DBC |
| 99 | 🇹🇯 Tajikistan | 55.7 | DCC |
| 100 | 🇭🇳 Honduras | 55.3 | DCC |
| 101 | 🇸🇿 Eswatini | 55.1 | DCC |
| 102 | 🇳🇮 Nicaragua | 54.5 | DCC |
| 103 | 🇬🇭 Ghana | 52.9 | CDC |
| 104 | 🇲🇲 Myanmar | 51.9 | BDB |
| 105 | 🇰🇭 Cambodia | 51.6 | CDC |
| 106 | 🇰🇪 Kenya | 51.3 | BDB |
| 107 | 🇲🇩 Moldova | 51.2 | DCD |
| 108 | 🇲🇳 Mongolia | 51.1 | DCD |
| 109 | 🇮🇳 India | 50.3 | BDD |
| 110 | 🇵🇰 Pakistan | 49.6 | CDD |
| 111 | 🇨🇮 Côte d’Ivoire | 49.3 | BDC |
| 112 | 🇿🇲 Zambia | 47.8 | CDB |
| 113 | 🇨🇲 Cameroon | 47.4 | BDD |
| 114 | 🇧🇩 Bangladesh | 47.1 | DDC |
| 115 | 🇿🇼 Zimbabwe | 46.0 | CDC |
| 116 | 🇲🇷 Mauritania | 45.6 | BDD |
| 117 | 🇳🇵 Nepal | 44.3 | DDC |
| 118 | 🇸🇳 Senegal | 43.4 | DDD |
| 119 | 🇹🇿 Tanzania | 42.5 | DDC |
| 120 | 🇪🇹 Ethiopia | 42.3 | DDC |
| 121 | 🇲🇬 Madagascar | 42.2 | CDC |
| 122 | 🇲🇿 Mozambique | 41.4 | DDC |
| 123 | 🇳🇬 Nigeria | 40.7 | BDD |
| 124 | 🇲🇼 Malawi | 39.1 | DDB |
| 125 | 🇧🇯 Benin | 36.3 | DDD |
| 126 | 🇹🇩 Chad | 33.8 | DDD |
| 127 | 🇨🇩 D.R.C. | 33.8 | DDC |
| 128 | 🇳🇪 Niger | 30.0 | DDD |
*The letter grade represents national performance in three dimensions. The first letter represents Security, the second letter represents Equity, the third letter represents the Environmental Sustainability. The top grade is AAA, the lowest is DDD.
Highs, Lows, and Outliers
Every country has unique circumstances — from strategic energy reserves to green energy ambitions — that shape their domestic energy policies. Let’s take a closer look at some of the more interesting situations around the world.
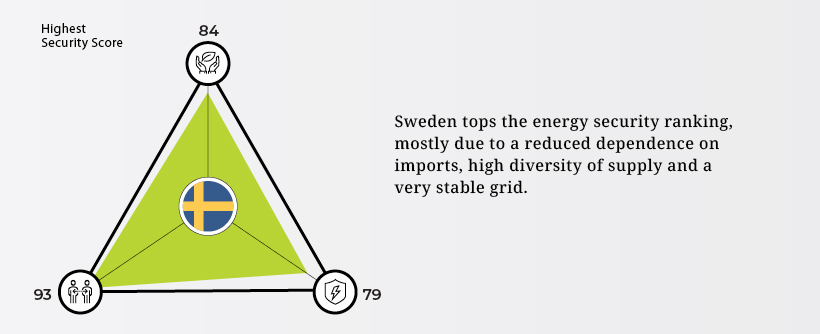
Sweden
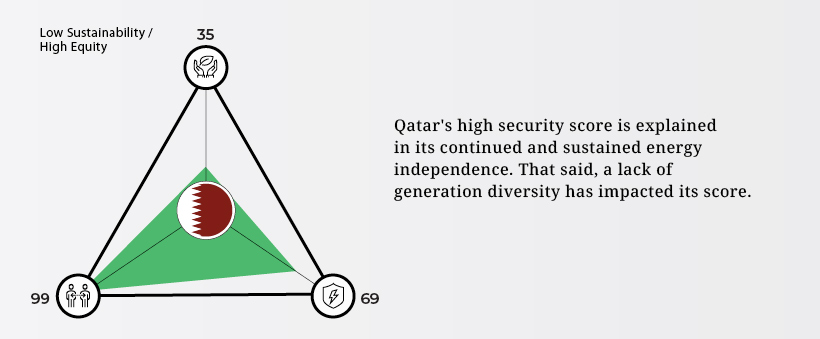
Qatar
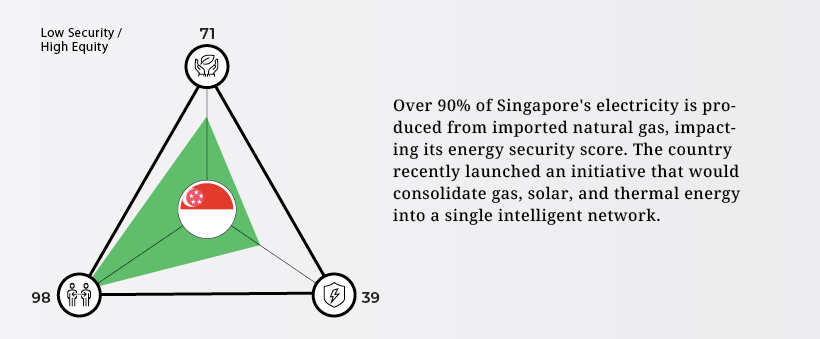
Singapore
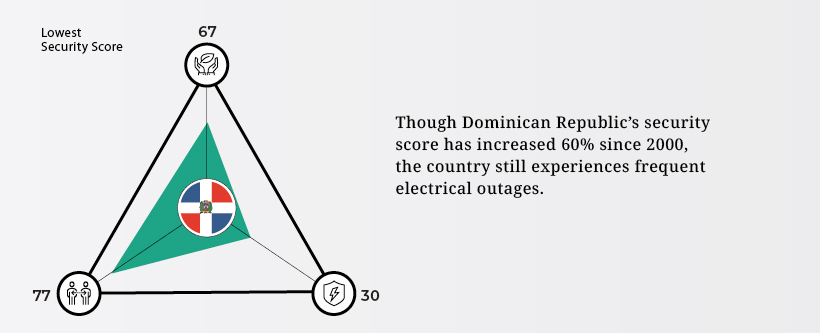
Dominican Republic
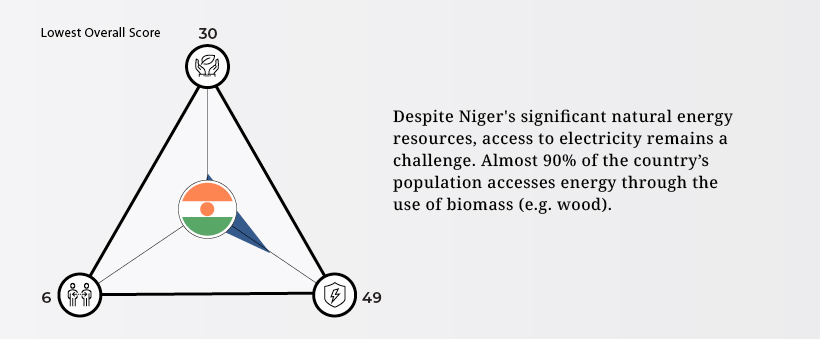
Niger
Global Energy Outlook
Achieving the balance of prosperity and sustainability is a goal of nearly every country, but it takes stability and the right mix of policies to get the job done.
The fact that many trilemma scores are improving is an indicator that the world’s patchwork of energy policies are slowly moving in the right direction.


Who’s Building the Most Solar Energy?
This was originally posted on our Voronoi app. Download the app for free on iOS or Android and discover incredible data-driven charts from a variety of trusted sources.
In 2023, solar energy accounted for three-quarters of renewable capacity additions worldwide. Most of this growth occurred in Asia, the EU, and the U.S., continuing a trend observed over the past decade.
In this graphic, we illustrate the rise in installed solar photovoltaic (PV) capacity in China, the EU, and the U.S. between 2010 and 2022, measured in gigawatts (GW). Bruegel compiled the data..
Chinese Dominance
As of 2022, China’s total installed capacity stands at 393 GW, nearly double that of the EU’s 205 GW and surpassing the USA’s total of 113 GW by more than threefold in absolute terms.
| Installed solar capacity (GW) | China | EU27 | U.S. |
|---|---|---|---|
| 2022 | 393.0 | 205.5 | 113.0 |
| 2021 | 307.0 | 162.7 | 95.4 |
| 2020 | 254.0 | 136.9 | 76.4 |
| 2019 | 205.0 | 120.1 | 61.6 |
| 2018 | 175.3 | 104.0 | 52.0 |
| 2017 | 130.8 | 96.2 | 43.8 |
| 2016 | 77.8 | 91.5 | 35.4 |
| 2015 | 43.6 | 87.7 | 24.2 |
| 2014 | 28.4 | 83.6 | 18.1 |
| 2013 | 17.8 | 79.7 | 13.3 |
| 2012 | 6.7 | 71.1 | 8.6 |
| 2011 | 3.1 | 53.3 | 5.6 |
| 2010 | 1.0 | 30.6 | 3.4 |
Since 2017, China has shown a compound annual growth rate (CAGR) of approximately 25% in installed PV capacity, while the USA has seen a CAGR of 21%, and the EU of 16%.
Additionally, China dominates the production of solar power components, currently controlling around 80% of the world’s solar panel supply chain.
In 2022, China’s solar industry employed 2.76 million individuals, with manufacturing roles representing approximately 1.8 million and the remaining 918,000 jobs in construction, installation, and operations and maintenance.
The EU industry employed 648,000 individuals, while the U.S. reached 264,000 jobs.
According to the IEA, China accounts for almost 60% of new renewable capacity expected to become operational globally by 2028.
Despite the phasing out of national subsidies in 2020 and 2021, deployment of solar PV in China is accelerating. The country is expected to reach its national 2030 target for wind and solar PV installations in 2024, six years ahead of schedule.

-

 Technology1 week ago
Countries With the Highest Rates of Crypto Ownership
-

 Mining6 days ago
Visualizing Copper Production by Country in 2023
-

 Politics7 days ago
Charted: How Americans Feel About Federal Government Agencies
-

 Healthcare1 week ago
Which Countries Have the Highest Infant Mortality Rates?
-

 Demographics1 week ago
Mapped: U.S. Immigrants by Region
-

 Economy1 week ago
Mapped: Southeast Asia’s GDP Per Capita, by Country
-

 Automotive1 week ago
How People Get Around in America, Europe, and Asia
-

 Personal Finance1 week ago
Visualizing the Tax Burden of Every U.S. State