Markets
Timing the Market: Why It’s So Hard, in One Chart
Subscribe to the Advisor Channel free mailing list for more like this
 Can I share this graphic?
 When do I need a license?
 Interested in this piece?
The Risks and Rewards of Timing the Market
This was originally posted on Advisor Channel. Sign up to the free mailing list to get beautiful visualizations on financial markets that help advisors and their clients.
Timing the market seems simple enough: buy when prices are low and sell when they’re high.
But there is clear evidence that market timing is difficult. Often, investors will sell early, missing out on a stock market rally. It can also be unnerving to invest when the market is flashing red.
By contrast, staying invested through highs and lows has generated competitive returns, especially over longer periods.
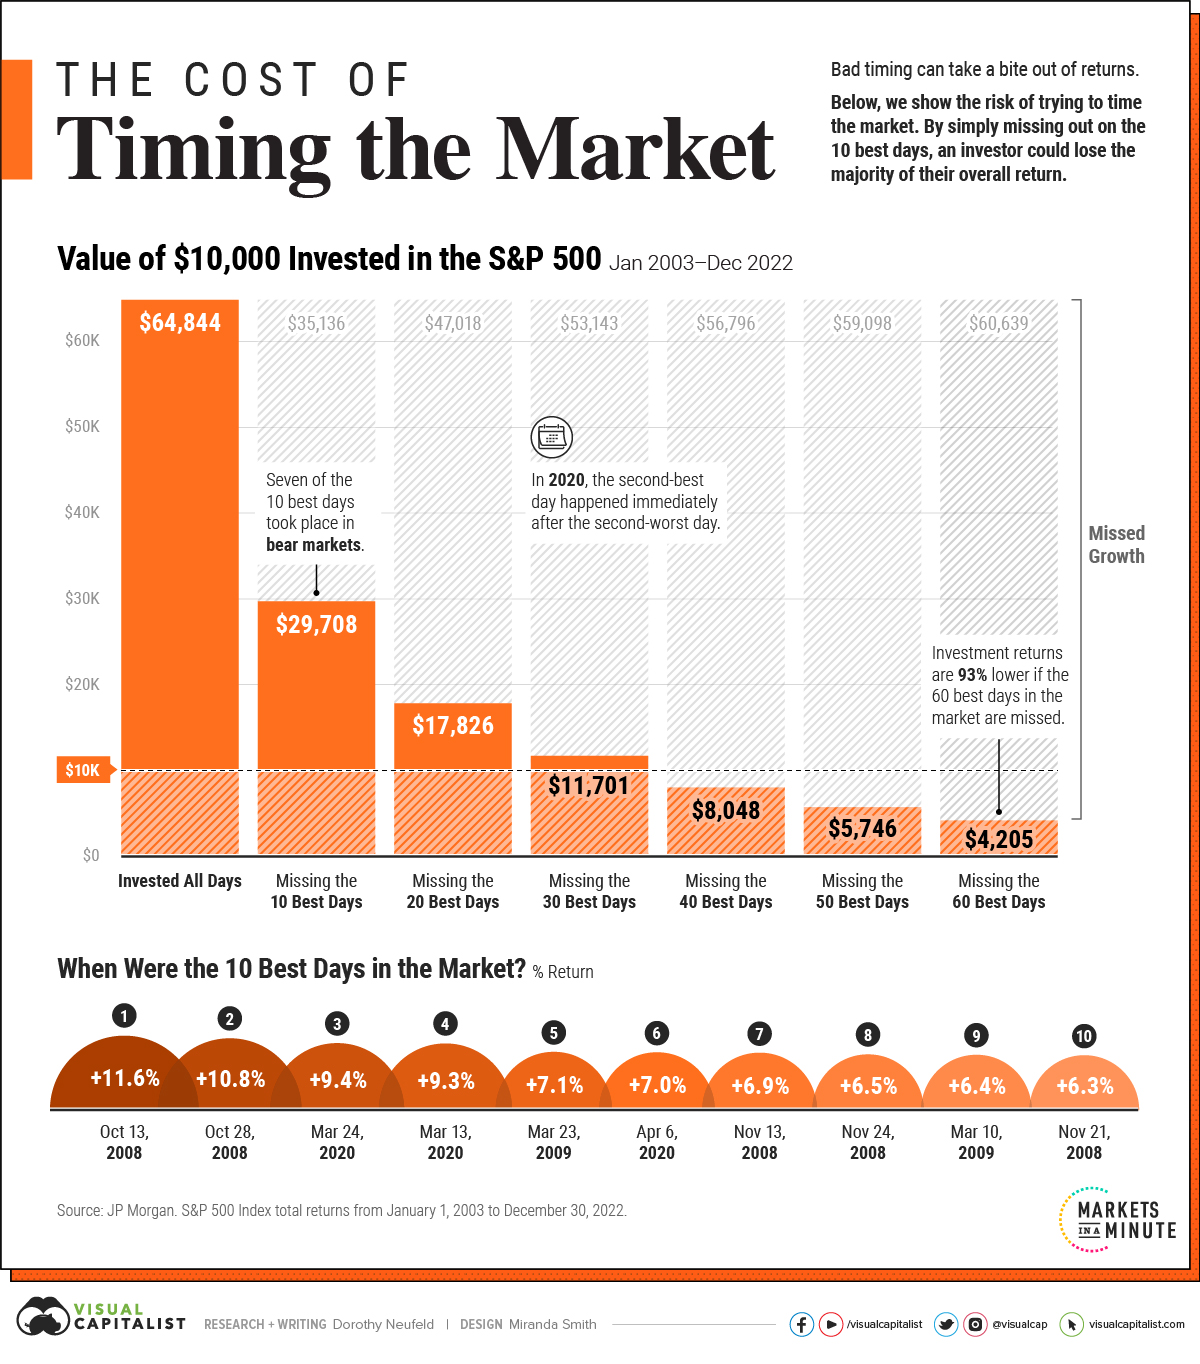
The above graphic shows how trying to time the market can take a bite out of your portfolio value, using 20 years of data from JP Morgan.
The Pitfalls of Timing the Market
Mistiming the market even by just a few days can significantly affect an investor’s returns.
The following scenarios compare the total returns of a $10,000 investment in the S&P 500 between January 1, 2003 and December 30, 2022. Specifically, it highlights the impact of missing the best days in the market compared to sticking to a long-term investment plan.
| Portfolio Value | Annual Return (2003-2022) | |
|---|---|---|
| Invested All Days | $64,844 | +9.8% |
| Missed 10 Best Days | $29,708 | +5.6% |
| Missed 20 Best Days | $17,826 | +2.9% |
| Missed 30 Best Days | $11,701 | +0.8% |
| Missed 40 Best Days | $8,048 | -1.1% |
| Missed 50 Best Days | $5,746 | -2.7% |
| Missed 60 Best Days | $4,205 | -4.2% |
As we can see in the above table, the original investment grew over sixfold if an investor was fully invested for all days.
If an investor were to simply miss the 10 best days in the market, they would have shed over 50% of their end portfolio value. The investor would finish with a portfolio of only $29,708, compared to $64,844 if they had just stayed put.
Making matters worse, by missing 60 of the best days, they would have lost a striking 93% in value compared to what the portfolio would be worth if they had simply stayed invested.
Overall, an investor would have seen almost 10% in average annual returns using a buy-and-hold strategy. Average annual returns entered negative territory once they missed the 40 best days over the time frame.
The Best Days in the Market
Why is timing the market so hard? Often, the best days take place during bear markets.
| Rank | Date | Return |
|---|---|---|
| 1 | Oct 13, 2008 | +12% |
| 2 | Oct 28, 2008 | +11% |
| 3 | Mar 24, 2020 | +9% |
| 4 | Mar 13, 2020 | +9% |
| 5 | Mar 23, 2009 | +7% |
| 6 | Apr 6, 2020 | +7% |
| 7 | Nov 13, 2008 | +7% |
| 8 | Nov 24, 2008 | +7% |
| 9 | Mar 10, 2009 | +6% |
| 10 | Nov 21, 2008 | +6% |
Over the last 20 years, seven of the 10 best days happened when the market was in bear market territory.
Adding to this, many of the best days take place shortly after the worst days. In 2020, the second-best day fell right after the second-worst day that year. Similarly, in 2015, the best day of the year occurred two days after its worst day.
Interestingly, the worst days in the market typically occurred in bull markets.
Why Staying Invested Benefits Investors
As historical data shows, the best days happen during market turmoil and periods of heightened market volatility. In missing the best days in the market, an investor risks losing out on meaningful return appreciation over the long run.
Not only does timing the market take considerable skill, it involves temperament, and a consistent track record. If there were bullet-proof signals for timing the market, they would be used by everyone.


Markets
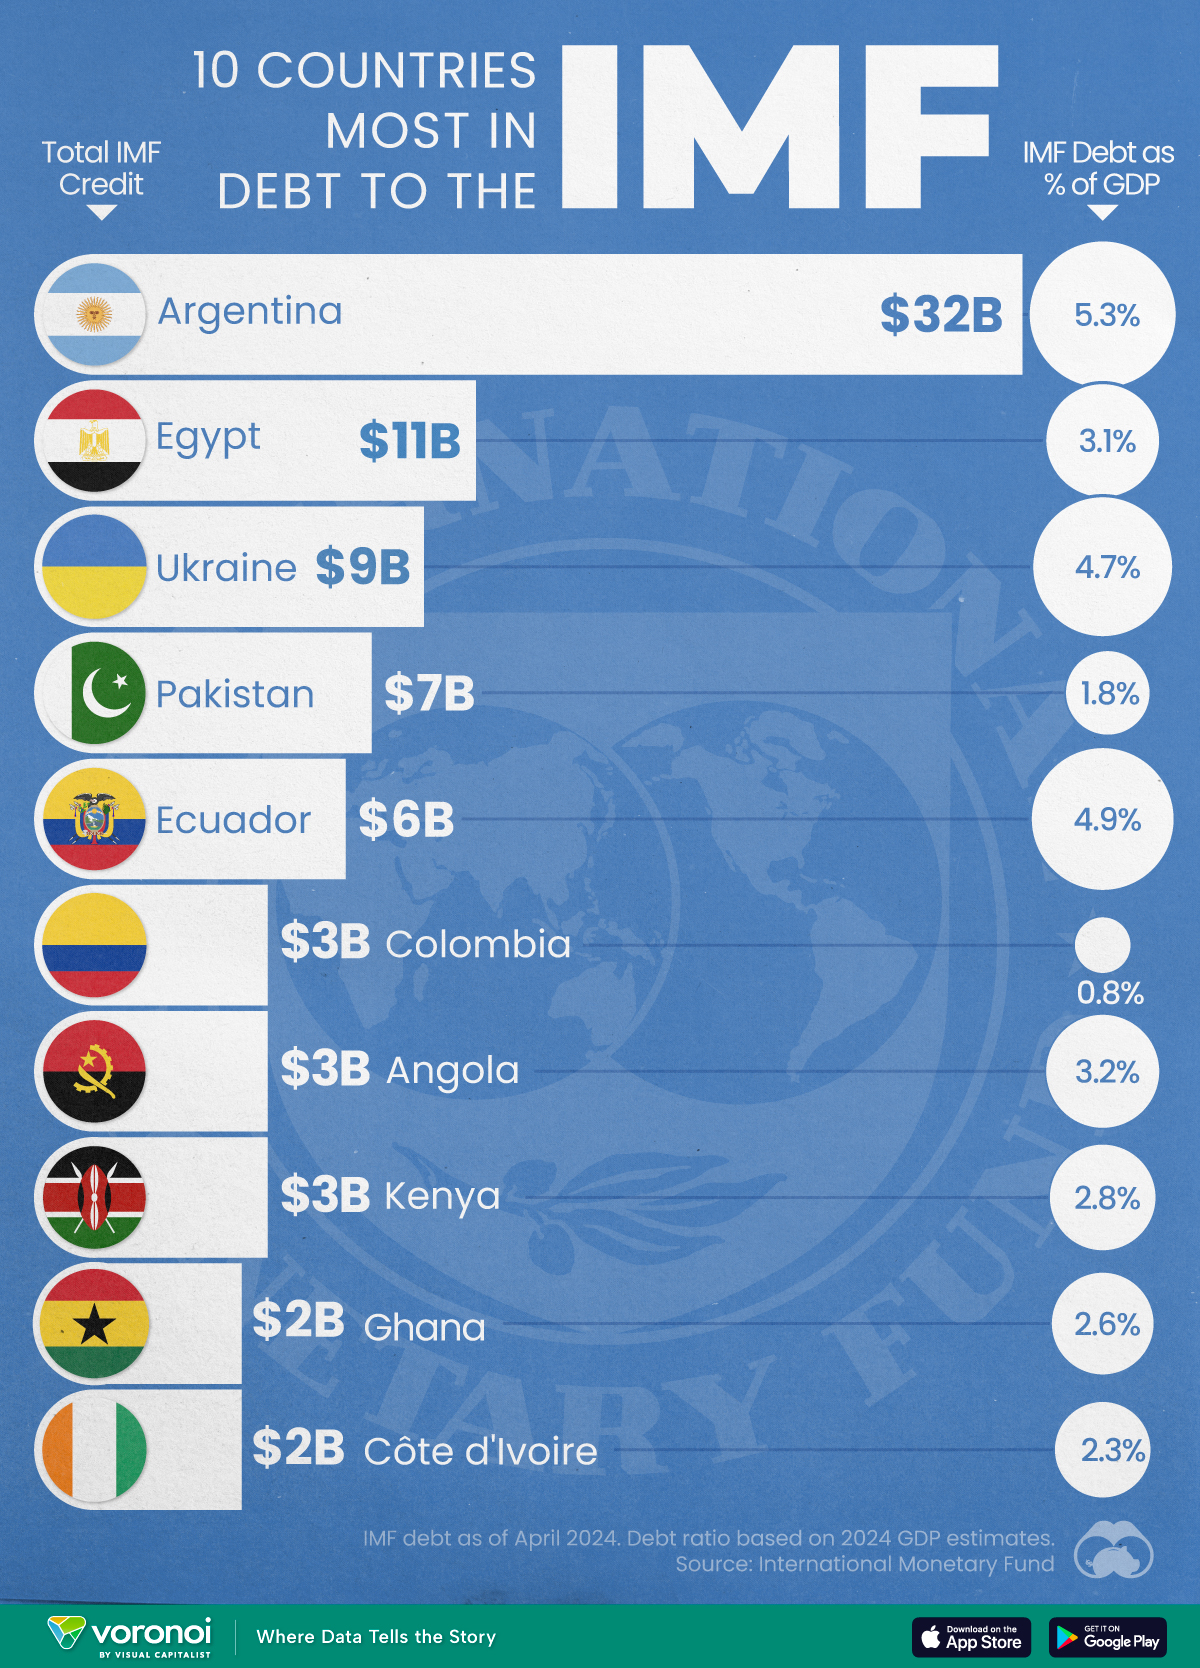
Top 10 Countries Most in Debt to the IMF
Argentina tops the ranking, with a debt equivalent to 5.3% of the country’s GDP.
Top 10 Countries Most in Debt to the IMF
This was originally posted on our Voronoi app. Download the app for free on iOS or Android and discover incredible data-driven charts from a variety of trusted sources.
Established in 1944, the International Monetary Fund (IMF) supports countries’ economic growth by providing financial aid and guidance on policies to enhance stability, productivity, and job opportunities.
Countries seek loans from the IMF to address economic crises, stabilize their currencies, implement structural reforms, and alleviate balance of payments difficulties.
In this graphic, we visualize the 10 countries most indebted to the fund.
Methodology
We compiled this ranking using the International Monetary Fund’s data on Total IMF Credit Outstanding. We selected the latest debt data for each country, accurate as of April 29, 2024.
Argentina Tops the Rank
Argentina’s debt to the IMF is equivalent to 5.3% of the country’s GDP. In total, the country owns more than $32 billion.
| Country | IMF Credit Outstanding ($B) | GDP ($B, 2024) | IMF Debt as % of GDP |
|---|---|---|---|
| 🇦🇷 Argentina | 32 | 604.3 | 5.3 |
| 🇪🇬 Egypt | 11 | 347.6 | 3.1 |
| 🇺🇦 Ukraine | 9 | 188.9 | 4.7 |
| 🇵🇰 Pakistan | 7 | 374.7 | 1.8 |
| 🇪🇨 Ecuador | 6 | 121.6 | 4.9 |
| 🇨🇴 Colombia | 3 | 386.1 | 0.8 |
| 🇦🇴 Angola | 3 | 92.1 | 3.2 |
| 🇰🇪 Kenya | 3 | 104.0 | 2.8 |
| 🇬🇭 Ghana | 2 | 75.2 | 2.6 |
| 🇨🇮 Ivory Coast | 2 | 86.9 | 2.3 |
A G20 member and major grain exporter, the country’s history of debt trouble dates back to the late 1890s when it defaulted after contracting debts to modernize the capital, Buenos Aires. It has already been bailed out over 20 times in the last six decades by the IMF.
Five of the 10 most indebted countries are in Africa, while three are in South America.
The only European country on our list, Ukraine has relied on international support amidst the conflict with Russia. It is estimated that Russia’s full-scale invasion of the country caused the loss of a third of the country’s economy. The country owes $9 billion to the IMF.
In total, almost 100 countries owe money to the IMF, and the grand total of all of these debts is $111 billion. The above countries (top 10) account for about 69% of these debts.
-

 Markets1 week ago
Mapped: The Most Valuable Company in Each Southeast Asian Country
-

 Personal Finance6 days ago
Visualizing the Tax Burden of Every U.S. State
-

 Mining7 days ago
Where the World’s Aluminum is Smelted, by Country
-

 Technology1 week ago
Countries With the Highest Rates of Crypto Ownership
-

 Money1 week ago
Charted: What Frustrates Americans About the Tax System
-

 Economy1 week ago
Mapped: Europe’s GDP Per Capita, by Country
-

 Stocks1 week ago
The Growth of a $1,000 Equity Investment, by Stock Market
-

 Healthcare1 week ago
Life Expectancy by Region (1950-2050F)