
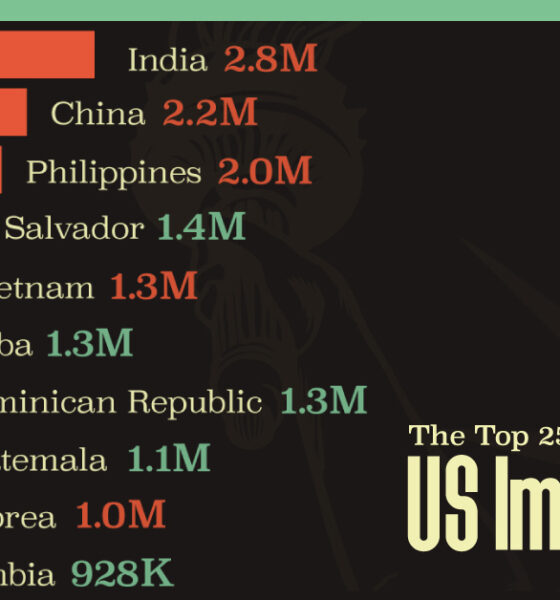
Mexico is the largest source of immigrants to the U.S., with almost 11 million immigrants.
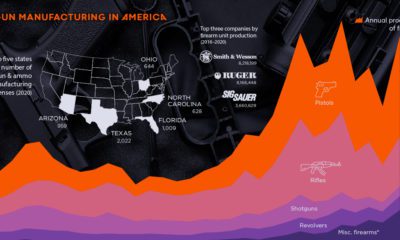

The U.S. has produced nearly 170 million firearms over the past three decades. Here are the numbers behind America's gun manufacturing sector.
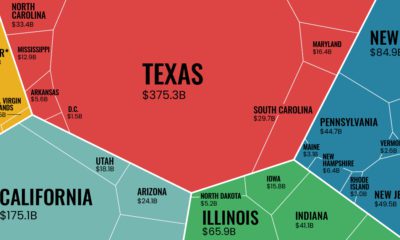

The U.S. exported $1.8 trillion worth of goods in 2021. This infographic looks at where that trade activity took place across the nation.
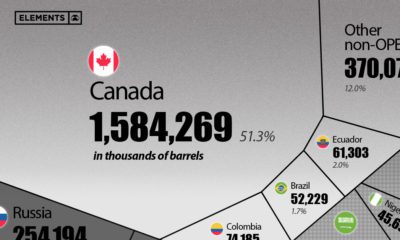

This visualization breaks down U.S. oil imports by country for 2021, showing the split by OPEC and non-OPEC nations.


Robust growth in mortgages has pushed U.S. consumer debt to nearly $16 trillion. Click to gain further insight into the situation.
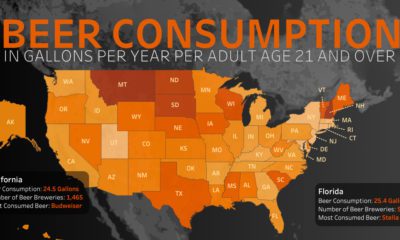

Which U.S. states consume the most beer per capita, and what beers do people prefer?
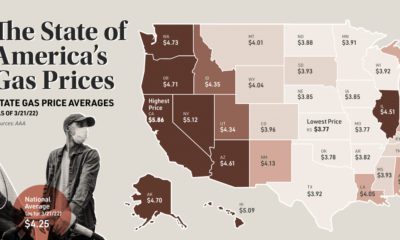

This map looks at gas prices across various states, and historical context for today's sky-high prices at the pump.


Russia faces a multitude of U.S. sanctions for its participation in global conflicts. This infographic lists who and what has been impacted.
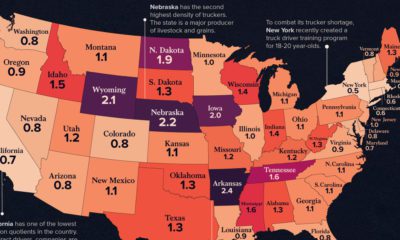

See how America's 1.8 million truckers are distributed across the nation in these two heatmap visualizations.
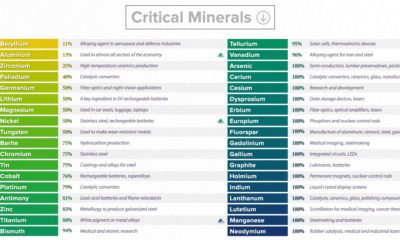

This graphic lists all minerals that are deemed critical to both the economic and national security of the United States.
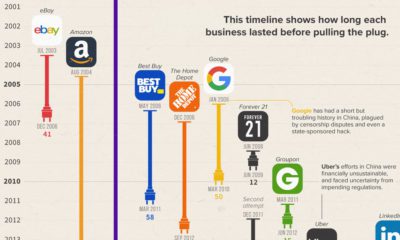

The Chinese market is notoriously difficult for foreign businesses to gain a foothold in. Here, we look at U.S. brands that tried and failed


 Creator Program