Misc
The Most Popular Cocktail Drinks in 2024
![]() See this visualization first on the Voronoi app.
See this visualization first on the Voronoi app.
Charted: Which are the Most Popular Cocktail Drinks?
This was originally posted on our Voronoi app. Download the app for free on iOS or Android and discover incredible data-driven charts from a variety of trusted sources.
Dry January might be be required to recover from the excesses of the holidays, but a whole new year beckons with more successes, milestones, and achievements, perhaps requiring more or less libations, depending on the country one is from.
But what are people craving from their alcohol mixes?
We chart out the most popular cocktail drinks in 2024, according to the annual consumer survey from the Bacardi Cocktail Trends Report.
Ranked: Most Popular Cocktails for 2024
The ever-versatile, but long-enduring Gin & Tonic comes in at first place (28%) for the most popular cocktail drink chosen by Bacardi’s survey respondents.
Allegedly, the Gin & Tonic traces back to 19th century India, when English soldiers began mixing their daily rations of quinine tonic with gin. Quinine was a common malaria drug up until the early 1900s.
The modern G&T is coupled with a fistful of ice and makes for a refreshing summer beverage. Its popularity is unparalleled across the Commonwealth, but also finds patrons in Europe, the U.S., Japan, and the Netherlands.
| Rank | Cocktail | % of Respondents |
|---|---|---|
| 1 | Gin & Tonic | 28% |
| 2 | Mojito | 27% |
| 3 | Margarita | 20% |
| 4 | Bloody Mary | 20% |
| 5 | Whisky and Coke | 19% |
| 6 | Pina Colada | 19% |
| 7 | Daiquiri | 18% |
| 8 | Rum and Coke | 17% |
| 9 | Gin Lemonade | 17% |
| 10 | Vodka Lemonade | 15% |
| 11 | Spritz | 15% |
| 12 | Martini | 14% |
| 13 | Irish Coffee | 14% |
| 14 | Vodka Soda | 14% |
| 15 | Cosmopolitan | 14% |
| 16 | Espresso Martini | 13% |
| 17 | Caipirinha | 12% |
| 18 | Tequila Sunrise | 11% |
| 19 | Whiskey Highball | 10% |
| 20 | Tequila Soda | 10% |
Note: The survey was designed as multiple choice, thus percentages do not sum to 100.
Another classic summer favorite, the Mojito comes in a close second (27%) by those surveyed. The white rum based cocktail originated in Cuba, though there is much debate on who (or which group) invented it first. Variations include using tequila instead of rum, adding muddled fruit, and switching out lime for lemon juice.
The Margarita and Bloody Mary tie for fourth place and the unpretentious but clearly popular Whiskey and Coke rounds out the top five.
Another 19% also love Piña Coladas (and possibly also dancing in the rain), a delicious blended mix of white-rum, cream of coconut, and pineapple juice. This island favorite is the official drink of Puerto Rico, from where it originates.
Ranked seven to 10, are two more rum-based drinks (the Daiquiri, and the Rum and Coke) and two lemonade mixes with gin and vodka respectively.
Misc
The Top 25 Nationalities of U.S. Immigrants
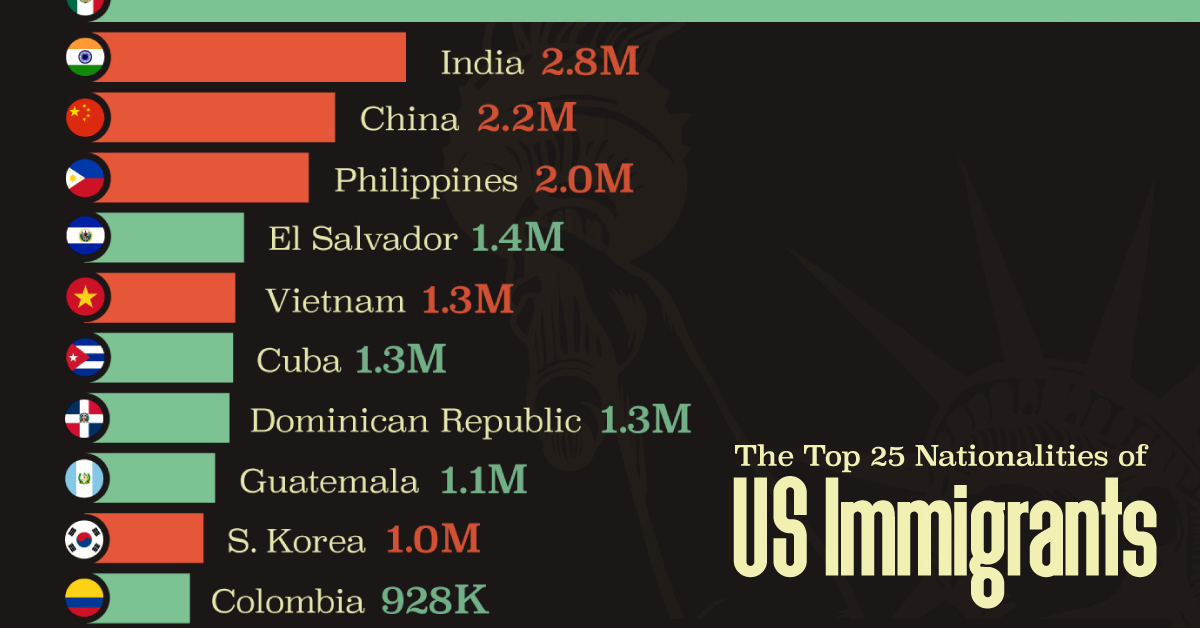
Mexico is the largest source of immigrants to the U.S., with almost 11 million immigrants.
The Top 25 Nationalities of U.S. Immigrants
This was originally posted on our Voronoi app. Download the app for free on iOS or Android and discover incredible data-driven charts from a variety of trusted sources.
The United States is home to more than 46 million immigrants, constituting approximately 14% of its total population.
This graphic displays the top 25 countries of origin for U.S. immigrants, based on 2022 estimates. The data is sourced from the Migration Policy Institute (MPI), which analyzed information from the U.S. Census Bureau’s 2022 American Community Survey.
In this context, “immigrants” refer to individuals residing in the United States who were not U.S. citizens at birth.
Mexico Emerges as a Leading Source of Immigration
Mexico stands out as the largest contributor to U.S. immigration due to its geographical proximity and historical ties.
Various economic factors, including wage disparities and employment opportunities, motivate many Mexicans to seek better prospects north of the border.
| Country | Region | # of Immigrants |
|---|---|---|
| 🇲🇽 Mexico | Latin America & Caribbean | 10,678,502 |
| 🇮🇳 India | Asia | 2,839,618 |
| 🇨🇳 China | Asia | 2,217,894 |
| 🇵🇭 Philippines | Asia | 1,982,333 |
| 🇸🇻 El Salvador | Latin America & Caribbean | 1,407,622 |
| 🇻🇳 Vietnam | Asia | 1,331,192 |
| 🇨🇺 Cuba | Latin America & Caribbean | 1,312,510 |
| 🇩🇴 Dominican Republic | Latin America & Caribbean | 1,279,900 |
| 🇬🇹 Guatemala | Latin America & Caribbean | 1,148,543 |
| 🇰🇷 Korea | Asia | 1,045,100 |
| 🇨🇴 Colombia | Latin America & Caribbean | 928,053 |
| 🇭🇳 Honduras | Latin America & Caribbean | 843,774 |
| 🇨🇦 Canada | Northern America | 821,322 |
| 🇯🇲 Jamaica | Latin America & Caribbean | 804,775 |
| 🇭🇹 Haiti | Latin America & Caribbean | 730,780 |
| 🇬🇧 United Kingdom | Europe | 676,652 |
| 🇻🇪 Venezuela | Latin America & Caribbean | 667,664 |
| 🇧🇷 Brazil | Latin America & Caribbean | 618,525 |
| 🇩🇪 Germany | Europe | 537,484 |
| 🇪🇨 Ecuador | Latin America & Caribbean | 518,287 |
| 🇵🇪 Peru | Latin America & Caribbean | 471,988 |
| 🇳🇬 Nigeria | Africa | 448,405 |
| 🇺🇦 Ukraine | Europe | 427,163 |
| 🇮🇷 Iran | Middle East | 407,283 |
| 🇵🇰 Pakistan | Asia | 399,086 |
| Rest of World | 11,637,634 | |
| Total | 46,182,089 |
Mexicans are followed in this ranking by Indians, Chinese, and Filipinos, though most immigrants on this list come from countries in the Latin American and Caribbean region.
On the other hand, only three European countries are among the top sources of U.S. immigrants: the UK, Germany, and Ukraine.
Immigration continues to be a significant factor contributing to the overall growth of the U.S. population. Overall population growth has decelerated over the past decade primarily due to declining birth rates.
Between 2021 and 2022, the increase in the immigrant population accounted for 65% of the total population growth in the U.S., representing 912,000 individuals out of nearly 1.4 million.
If you enjoyed this post, be sure to check out Visualized: Why Do People Immigrate to the U.S.? This visualization shows the different reasons cited by new arrivals to America in 2021.
-

 United States1 week ago
Mapped: Countries Where Recreational Cannabis is Legal
-
 Healthcare2 weeks ago
Life Expectancy by Region (1950-2050F)
-

 Markets2 weeks ago
The Growth of a $1,000 Equity Investment, by Stock Market
-

 Markets2 weeks ago
Mapped: Europe’s GDP Per Capita, by Country
-

 Money2 weeks ago
Charted: What Frustrates Americans About the Tax System
-

 Technology2 weeks ago
Countries With the Highest Rates of Crypto Ownership
-

 Mining2 weeks ago
Where the World’s Aluminum is Smelted, by Country
-

 Personal Finance2 weeks ago
Visualizing the Tax Burden of Every U.S. State


