Visualizing $2.5 Trillion in Private Equity Cash Reserves


Visualizing $2.5 Trillion in Private Equity Cash Reserves
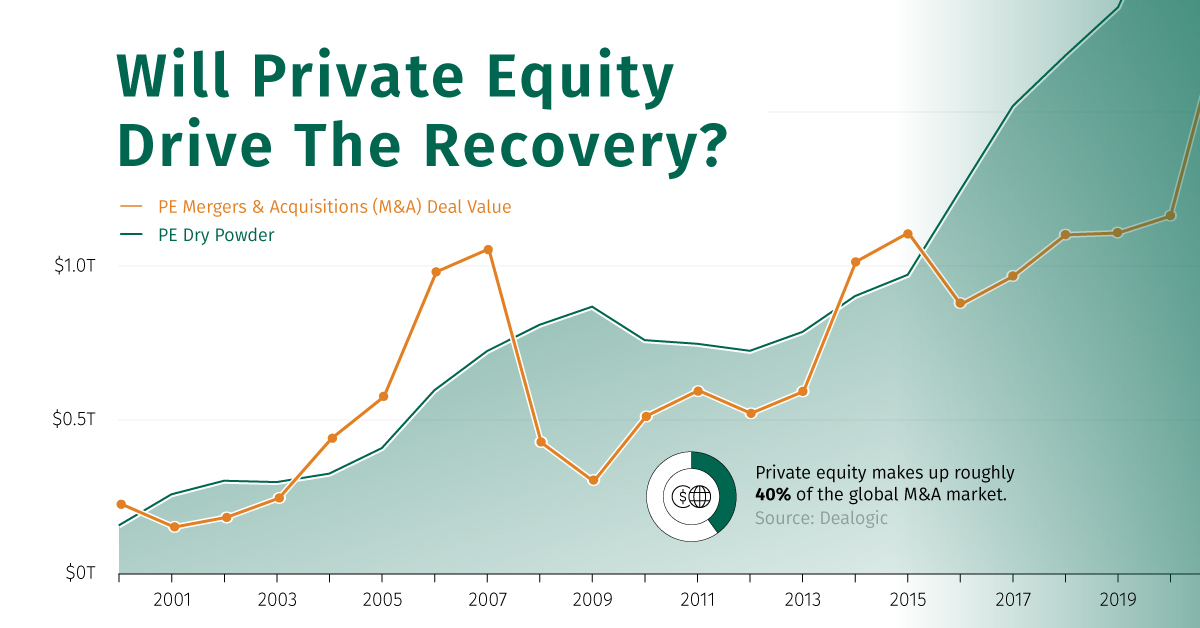
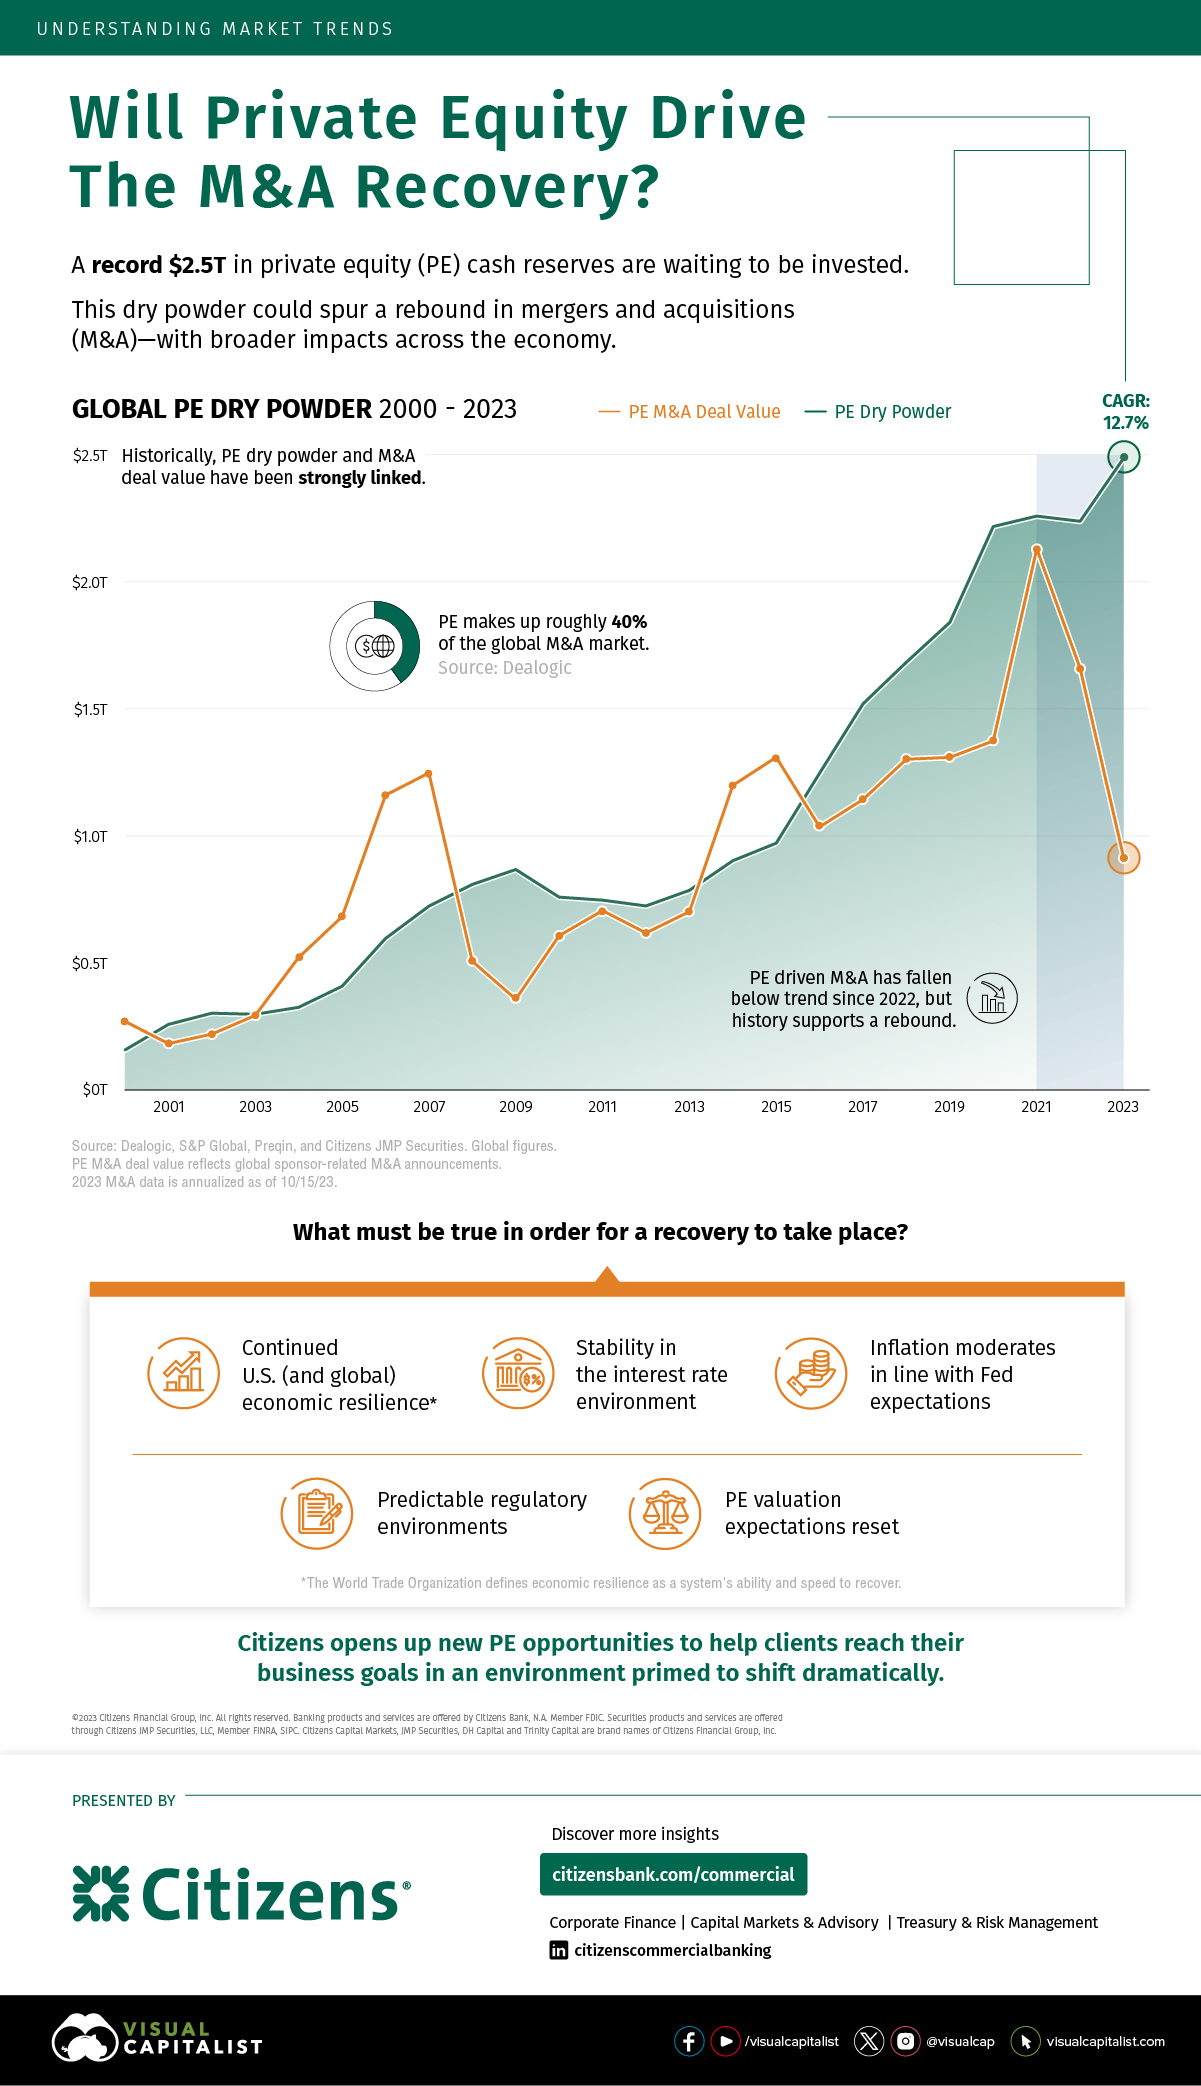
Private equity (PE) firms, which invest in companies that are not publicly-listed, are sitting on a record $2.5 trillion in cash reserves.
PE firms deploy this cash to acquire private companies ripe for growth, with the goal of driving higher valuations. Historically, a higher store of cash has been strongly linked to greater PE deal activity.
Despite this stockpile, activity remains muted. As interest rates sit at multi-decade highs in an uncertain market environment, mergers and acquisitions (M&A) have fallen to 10-year lows.
This graphic, sponsored by Citizens, shows the historic rise in cash reserves, and why this may spur a recovery in M&A deal activity.
Is Private Equity Primed for a Rebound?
Since 2000, global PE cash reserves—also known as dry powder—have grown at a 12.7% compound annual growth rate.
This capital has been a key source of growth and funding for companies, with PE making up roughly 40% of the global M&A market. The table below shows global PE dry powder and M&A deal value in 2023:
| Year | Global Dry Powder | Global M&A Deal Value |
|---|---|---|
| 2023 | $2,485B | $776B* |
| 2022 | $2,237B | $1,403B |
| 2021 | $2,258B | $2,130B |
| 2020 | $2,217B | $1,162B |
| 2019 | $1,840B | $1,107B |
| 2018 | $1,683B | $1,101B |
| 2017 | $1,520B | $967B |
| 2016 | $1,246B | $876B |
| 2015 | $971B | $1,108B |
| 2014 | $902B | $1,014B |
| 2013 | $786B | $594B |
| 2012 | $724B | $523B |
| 2011 | $747B | $597B |
| 2010 | $759B | $514B |
| 2009 | $868B | $302B |
| 2008 | $809B | $429B |
| 2007 | $723B | $1,056B |
| 2006 | $596B | $982B |
| 2005 | $408B | $577B |
| 2004 | $326B | $441B |
| 2003 | $298B | $249B |
| 2002 | $302B | $186B |
| 2001 | $258B | $155B |
| 2000 | $158BB | $229B |
*2023 M&A deal value annualized as of 10/15/2023. Source: Dealogic, S&P Global, Preqin, and Citizens JMP Securities. PE M&A deal value reflects sponsor-related M&A announcements.
As we can see in the table above, 2023 has been an aberration for global M&A deal activity. Since last year, M&A deal value has declined 75% to $776 billion.
Today, high interest rates are putting pressure on borrowing costs, with many PE firms waiting in the wings for conditions to improve. The majority of deals are happening among smaller companies, while PE firms hold out on mega-deals.
Nevertheless, this vast amount of dry powder could help fuel an eventual recovery.
Key Factors for a Recovery
Looking ahead, the following market conditions will be important for a revival in PE deal activity:
- Continued U.S. (and global) economic resilience
- Stability in the interest rate environment
- Inflation moderates in line with Fed expectations
- Predictable regulatory environments
- PE valuation expectations reset
With PE firms holding significant cash piles, key opportunities could open up if conditions improve. As a result, the PE market could be well-positioned for growth in an environment primed for a rebound—with impacts across the wider economy.
Explore more insights with Citizens.

-

 Maps16 hours ago
Mapped: The 10 U.S. States With the Lowest Real GDP Growth
In this graphic, we show where real GDP lagged the most across America in 2023 as high interest rates weighed on state economies.
-

 Finance19 hours ago
Ranked: The World’s 50 Largest Private Equity Firms
In this graphic, we show the largest private equity firms in the world—from titan Blackstone to China’s leading alternative funds.
-

 Markets2 days ago
Top 10 Countries Most in Debt to the IMF
Argentina tops the ranking, with a debt equivalent to 5.3% of the country’s GDP.
-

 Markets3 days ago
Ranked: The Top 6 Economies by Share of Global GDP (1980-2024)
Gain a unique perspective on the world’s economic order from this graphic showing % share of global GDP over time.
-

 Markets1 week ago
Mapped: Europe’s GDP Per Capita, by Country
Which European economies are richest on a GDP per capita basis? This map shows the results for 44 countries across the continent.
-

 Markets1 week ago
The Growth of a $1,000 Equity Investment, by Stock Market
In this graphic, we’ve visualized stock market growth by country over the past five years using major indices.