Markets
Panama Canal Traffic by Shipment Category and Tonnage
![]() See this visualization first on the Voronoi app.
See this visualization first on the Voronoi app.
Panama Canal Traffic by Shipment Category and Tonnage
This was originally posted on our Voronoi app. Download the app for free on iOS or Android and discover incredible data-driven charts from a variety of trusted sources.
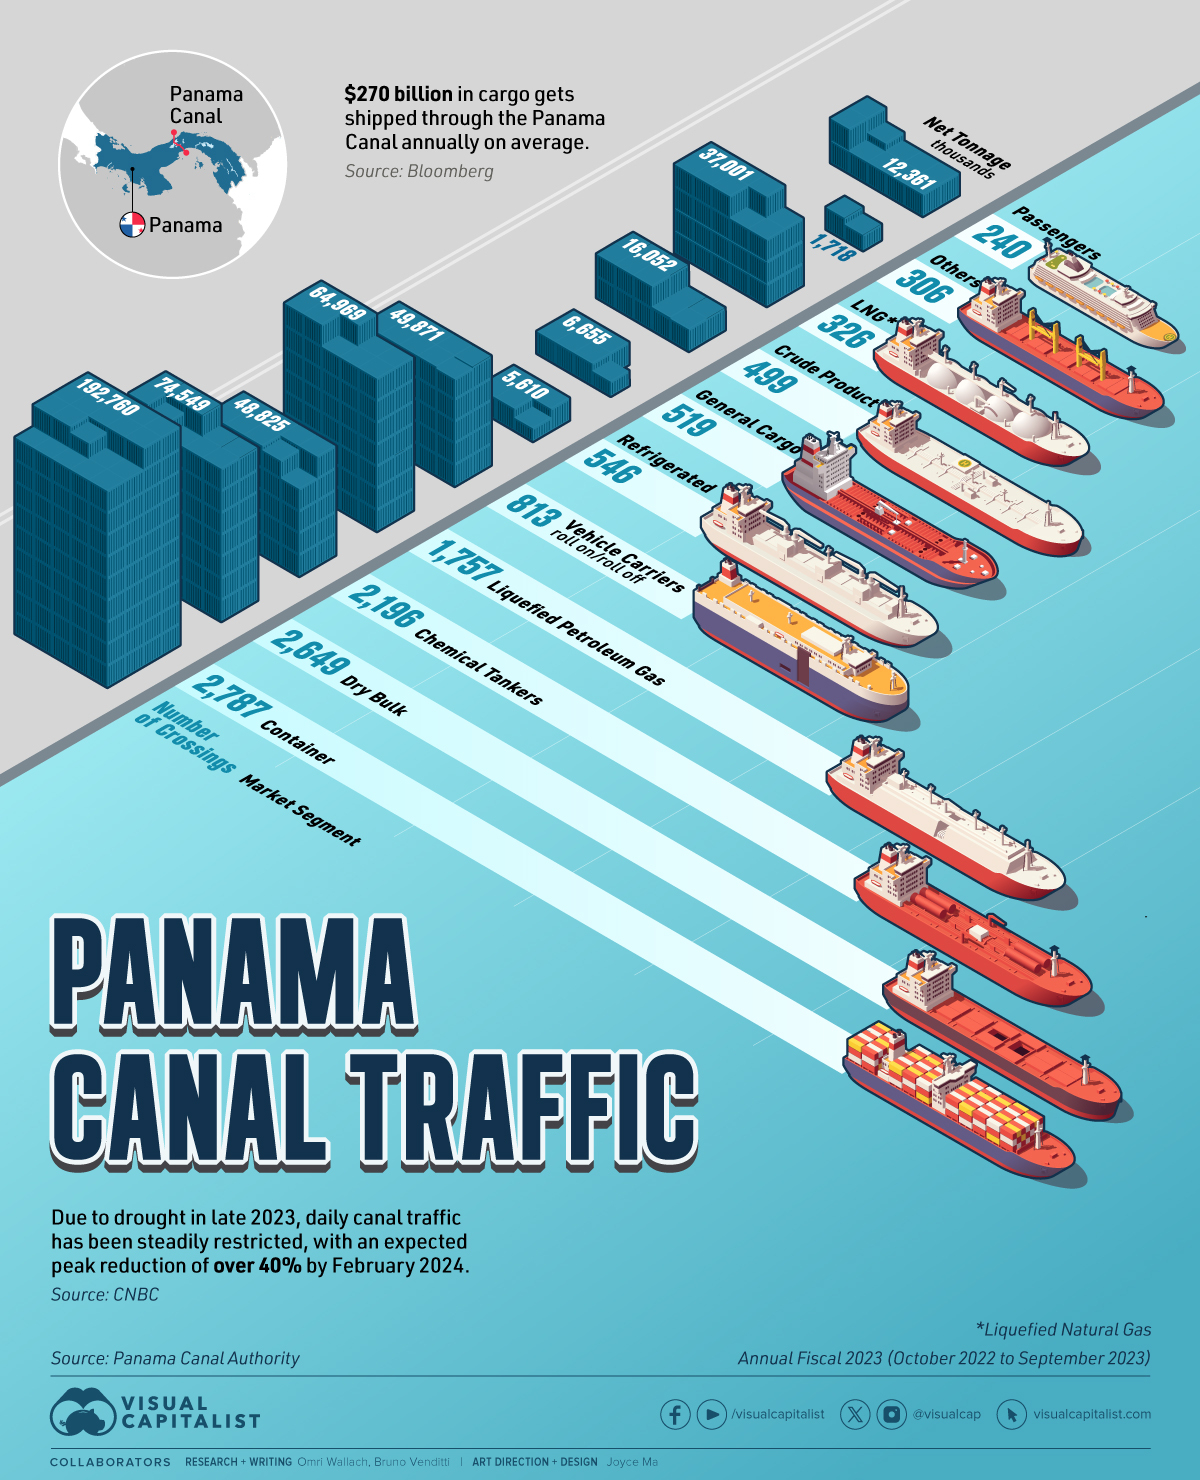
Daily Panama Canal traffic has been steadily restricted to start the year, with an expected peak reduction of over 40% by February 2024 due to severe drought. The problem is already affecting supply chains for U.S. and Asian importers.
This graphic illustrates the number of shipping crossings by market segment at the Canal and the net tonnage carried during the Annual Fiscal 2023 (October 2022 to September 2023). Data is from the Panama Canal Authority.
About the Panama Canal
The Panama Canal is an artificial 82-kilometer (51-mile) waterway that connects the Pacific Ocean with the Atlantic Ocean, built between 1904 and 1914.
The Canal locks at each end lift ships to Gatun Lake, an artificial freshwater lake 26 meters (85 ft) above sea level. The shortcut dramatically reduces the time for ships to travel between the two oceans, enabling them to avoid the route around the southernmost tip of South America via the Drake Passage or Strait of Magellan.
The Panama Canal moves roughly $270 billion worth of cargo annually–it’s the trade route taken by 40% of all U.S. container traffic alone and handles about 5% of all global maritime trade.
The Driest October in 70 Years
Last October, however, Panama received 41% less rainfall than usual, leading to the driest October in 70 years in what was supposed to be Panama’s rainy season, bringing the level of the Gatun Lake almost six feet below where it was a year ago. Additionally, infrastructure constraints led the Panama Canal Authority to restrict the number of ships that could pass each day.
The principal commodity groups carried through the Canal are motor vehicles, petroleum products, grains, coal, and coke.
| Market Segment | Transits (#) | Net Tonnage (thousands) |
|---|---|---|
| Container | 2,787 | 192,760 |
| Dy Bulk | 2,649 | 74,549 |
| Chemical Tankers | 2,196 | 48,825 |
| Liquefied Petroleum Gas | 1,757 | 64,969 |
| Vehicle Carriers | 813 | 49,871 |
| Refrigerated | 546 | 5,610 |
| General Cargo | 519 | 6,655 |
| Crude Product Tankers | 499 | 16,052 |
| Liquefied Natural Gas | 326 | 37,001 |
| Other | 306 | 1,718 |
| Passengers | 240 | 12,361 |
| Total | 12,638 | 510,370 |
According to the Panama Canal Authority, most of its traffic came from containers and dry bulk like soybeans. The world’s largest operator of chemical tankers (Stolt-Nielsen) typically also uses the Canal. However, due to the drought and the backup at the crossing, the operator has decided to reroute its fleet to the Suez Canal.
Although representing the smaller number of crossings, the Canal is also an important route for passengers, with many ocean cruise lines offering popular Panama Canal itineraries that sail through the Canal in the approximately 8-hour passage to their next destination in the opposite ocean.


Maps
Mapped: The 10 U.S. States With the Lowest Real GDP Growth
In this graphic, we show where real GDP lagged the most across America in 2023 as high interest rates weighed on state economies.


The Top 10 U.S. States, by Lowest Real GDP Growth
This was originally posted on our Voronoi app. Download the app for free on iOS or Android and discover incredible data-driven charts from a variety of trusted sources.
While the U.S. economy defied expectations in 2023, posting 2.5% in real GDP growth, several states lagged behind.
Last year, oil-producing states led the pack in terms of real GDP growth across America, while the lowest growth was seen in states that were more sensitive to the impact of high interest rates, particularly due to slowdowns in the manufacturing and finance sectors.
This graphic shows the 10 states with the least robust real GDP growth in 2023, based on data from the Bureau of Economic Analysis.
Weakest State Economies in 2023
Below, we show the states with the slowest economic activity in inflation-adjusted terms, using chained 2017 dollars:
| Rank | State | Real GDP Growth 2023 YoY | Real GDP 2023 |
|---|---|---|---|
| 1 | Delaware | -1.2% | $74B |
| 2 | Wisconsin | +0.2% | $337B |
| 3 | New York | +0.7% | $1.8T |
| 4 | Missississippi | +0.7% | $115B |
| 5 | Georgia | +0.8% | $661B |
| 6 | Minnesota | +1.2% | $384B |
| 7 | New Hampshire | +1.2% | $91B |
| 8 | Ohio | +1.2% | $698B |
| 9 | Iowa | +1.3% | $200B |
| 10 | Illinois | +1.3% | $876B |
| U.S. | +2.5% | $22.4T |
Delaware witnessed the slowest growth in the country, with real GDP growth of -1.2% over the year as a sluggish finance and insurance sector dampened the state’s economy.
Like Delaware, the Midwestern state of Wisconsin also experienced declines across the finance and insurance sector, in addition to steep drops in the agriculture and manufacturing industries.
America’s third-biggest economy, New York, grew just 0.7% in 2023, falling far below the U.S. average. High interest rates took a toll on key sectors, with notable slowdowns in the construction and manufacturing sectors. In addition, falling home prices and a weaker job market contributed to slower economic growth.
Meanwhile, Georgia experienced the fifth-lowest real GDP growth rate. In March 2024, Rivian paused plans to build a $5 billion EV factory in Georgia, which was set to be one of the biggest economic development initiatives in the state in history.
These delays are likely to exacerbate setbacks for the state, however, both Kia and Hyundai have made significant investments in the EV industry, which could help boost Georgia’s manufacturing sector looking ahead.

-

 Public Opinion6 days ago
Charted: How Americans Feel About Federal Government Agencies
-

 Healthcare2 weeks ago
What Causes Preventable Child Deaths?
-

 Energy2 weeks ago
Who’s Building the Most Solar Energy?
-

 Markets1 week ago
Mapped: The Most Valuable Company in Each Southeast Asian Country
-

 Technology1 week ago
Mapped: The Number of AI Startups By Country
-

 Healthcare1 week ago
Life Expectancy by Region (1950-2050F)
-

 Markets1 week ago
The Growth of a $1,000 Equity Investment, by Stock Market
-

 Markets1 week ago
Mapped: Europe’s GDP Per Capita, by Country