Mapped: The 10 U.S. States With the Lowest Real GDP Growth
Ranked: The World’s 50 Largest Private Equity Firms
Top 10 Countries Most in Debt to the IMF
Ranked: The Top 6 Economies by Share of Global GDP (1980-2024)
Mapped: Europe’s GDP Per Capita, by Country
Countries With the Highest Rates of Crypto Ownership
Mapped: The Number of AI Startups By Country
All of the Grants Given by the U.S. CHIPS Act
Visualizing AI Patents by Country
How Tech Logos Have Evolved Over Time
Visualizing America’s Average Retirement Savings, by Age
Visualizing the Tax Burden of Every U.S. State
Charted: What Frustrates Americans About the Tax System
Ranked: The Top 20 Countries in Debt to China
Mapped: Countries Where Recreational Cannabis is Legal
Which Countries Have the Highest Infant Mortality Rates?
Life Expectancy by Region (1950-2050F)
What Causes Preventable Child Deaths?
The Cost of an EpiPen in Major Markets
Who’s Building the Most Solar Energy?
Mapped: The Age of Energy Projects in Interconnection Queues, by State
Ranked: The Top 10 EV Battery Manufacturers in 2023
The World’s Biggest Nuclear Energy Producers
The World’s Biggest Oil Producers in 2023
Mapped: The Top Exports in Asian Countries
Mapped: U.S. States By Number of Cities Over 250,000 Residents
Mapped: U.S. Immigrants by Region
The Biggest Salt Producing Countries in 2023
Visualizing Copper Production by Country in 2023
Where the World’s Aluminum is Smelted, by Country
Visualizing Global Gold Production in 2023
How People Get Around in America, Europe, and Asia
The Carbon Footprint of Major Travel Methods
Ranking the Top 15 Countries by Carbon Tax Revenue
Ranked: The Countries With the Most Air Pollution in 2023
Top Countries By Forest Growth Since 2001
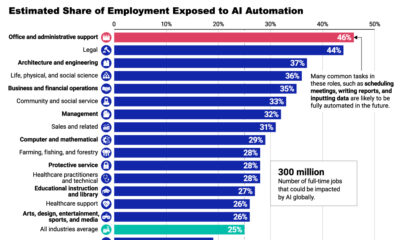
AI automation is expected to impact some industries more than others. See the latest projections in this infographic.
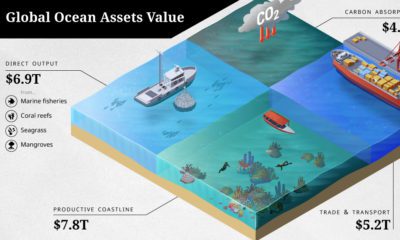
The ocean economy is under threat. How are human activities impacting the sustainable use of our ocean assets, valued at over $24 trillion?
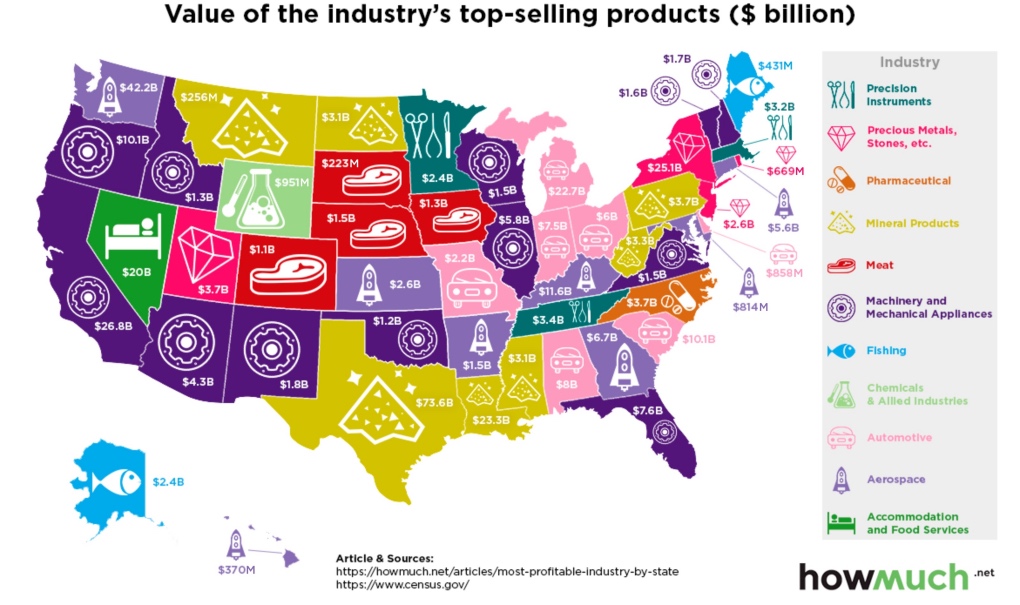
Which industries reign supreme in the United States? This map breaks down the most profitable industry, state by state.
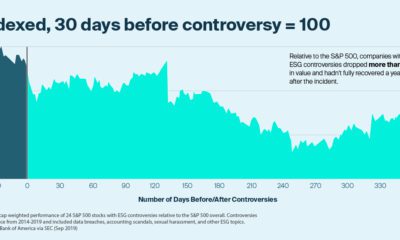
ESG controversies can damage a company's value, but ESG data may be able to help manage this risk. What are other reasons for using ESG data?
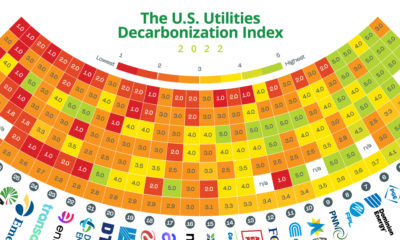
This graphic quantifies and compares the state of decarbonization among the 30 largest investor-owned utilities in the United States.
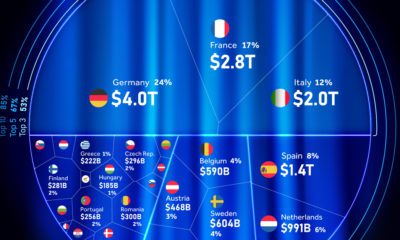
This chart shows the contributors to the EU economy through a percentage-wise distribution of country-level GDP.
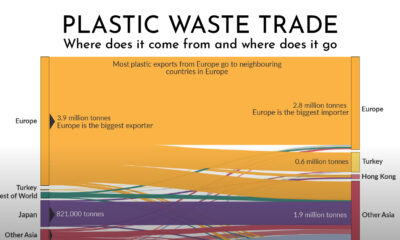
Which countries are responsible for exporting the world's plastic waste? This graphic shows the flow of global plastic waste through exports and imports.
This graphic compares the cost of living and purchasing power of 578 cities worldwide, using New York City as a benchmark for comparison.
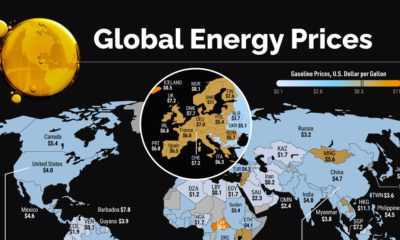
Energy prices have been extremely volatile in 2022. Which countries are seeing the highest prices in the world?
Major financial centers—London, Singapore, and Hong Kong—feature in these rankings of cities with the most millionaires.


 Creator Program