Mapped: The 10 U.S. States With the Lowest Real GDP Growth
Ranked: The World’s 50 Largest Private Equity Firms
Top 10 Countries Most in Debt to the IMF
Ranked: The Top 6 Economies by Share of Global GDP (1980-2024)
Mapped: Europe’s GDP Per Capita, by Country
Countries With the Highest Rates of Crypto Ownership
Mapped: The Number of AI Startups By Country
All of the Grants Given by the U.S. CHIPS Act
Visualizing AI Patents by Country
How Tech Logos Have Evolved Over Time
Visualizing America’s Average Retirement Savings, by Age
Visualizing the Tax Burden of Every U.S. State
Charted: What Frustrates Americans About the Tax System
Ranked: The Top 20 Countries in Debt to China
Mapped: Countries Where Recreational Cannabis is Legal
Which Countries Have the Highest Infant Mortality Rates?
Life Expectancy by Region (1950-2050F)
What Causes Preventable Child Deaths?
The Cost of an EpiPen in Major Markets
Who’s Building the Most Solar Energy?
Mapped: The Age of Energy Projects in Interconnection Queues, by State
Ranked: The Top 10 EV Battery Manufacturers in 2023
The World’s Biggest Nuclear Energy Producers
The World’s Biggest Oil Producers in 2023
Mapped: The Top Exports in Asian Countries
Mapped: U.S. States By Number of Cities Over 250,000 Residents
Mapped: U.S. Immigrants by Region
The Biggest Salt Producing Countries in 2023
Visualizing Copper Production by Country in 2023
Where the World’s Aluminum is Smelted, by Country
Visualizing Global Gold Production in 2023
How People Get Around in America, Europe, and Asia
The Carbon Footprint of Major Travel Methods
Ranking the Top 15 Countries by Carbon Tax Revenue
Ranked: The Countries With the Most Air Pollution in 2023
Top Countries By Forest Growth Since 2001
America is home to the most billionaires in the world. But which billionaire is the richest in each state?
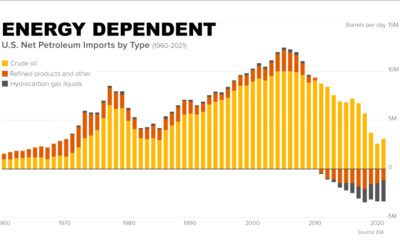
This infographic traces the history of U.S. energy independence, showing the events that have shaped oil demand and imports over 150 years.
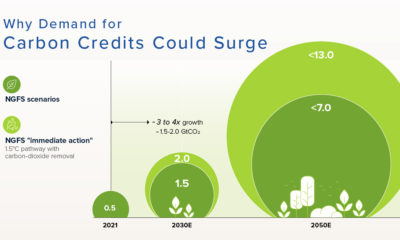
Carbon credits play a vital role in meeting the goals of the Paris Agreement. Here's why demand is set to skyrocket 25-fold by 2050.
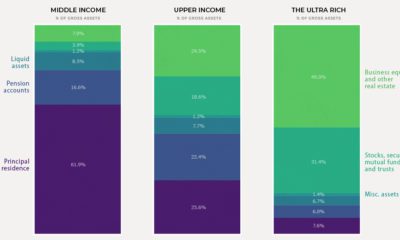
Today's chart shows how the composition of wealth tends to change as net worth increases, illustrating the building blocks that make up household net worth.
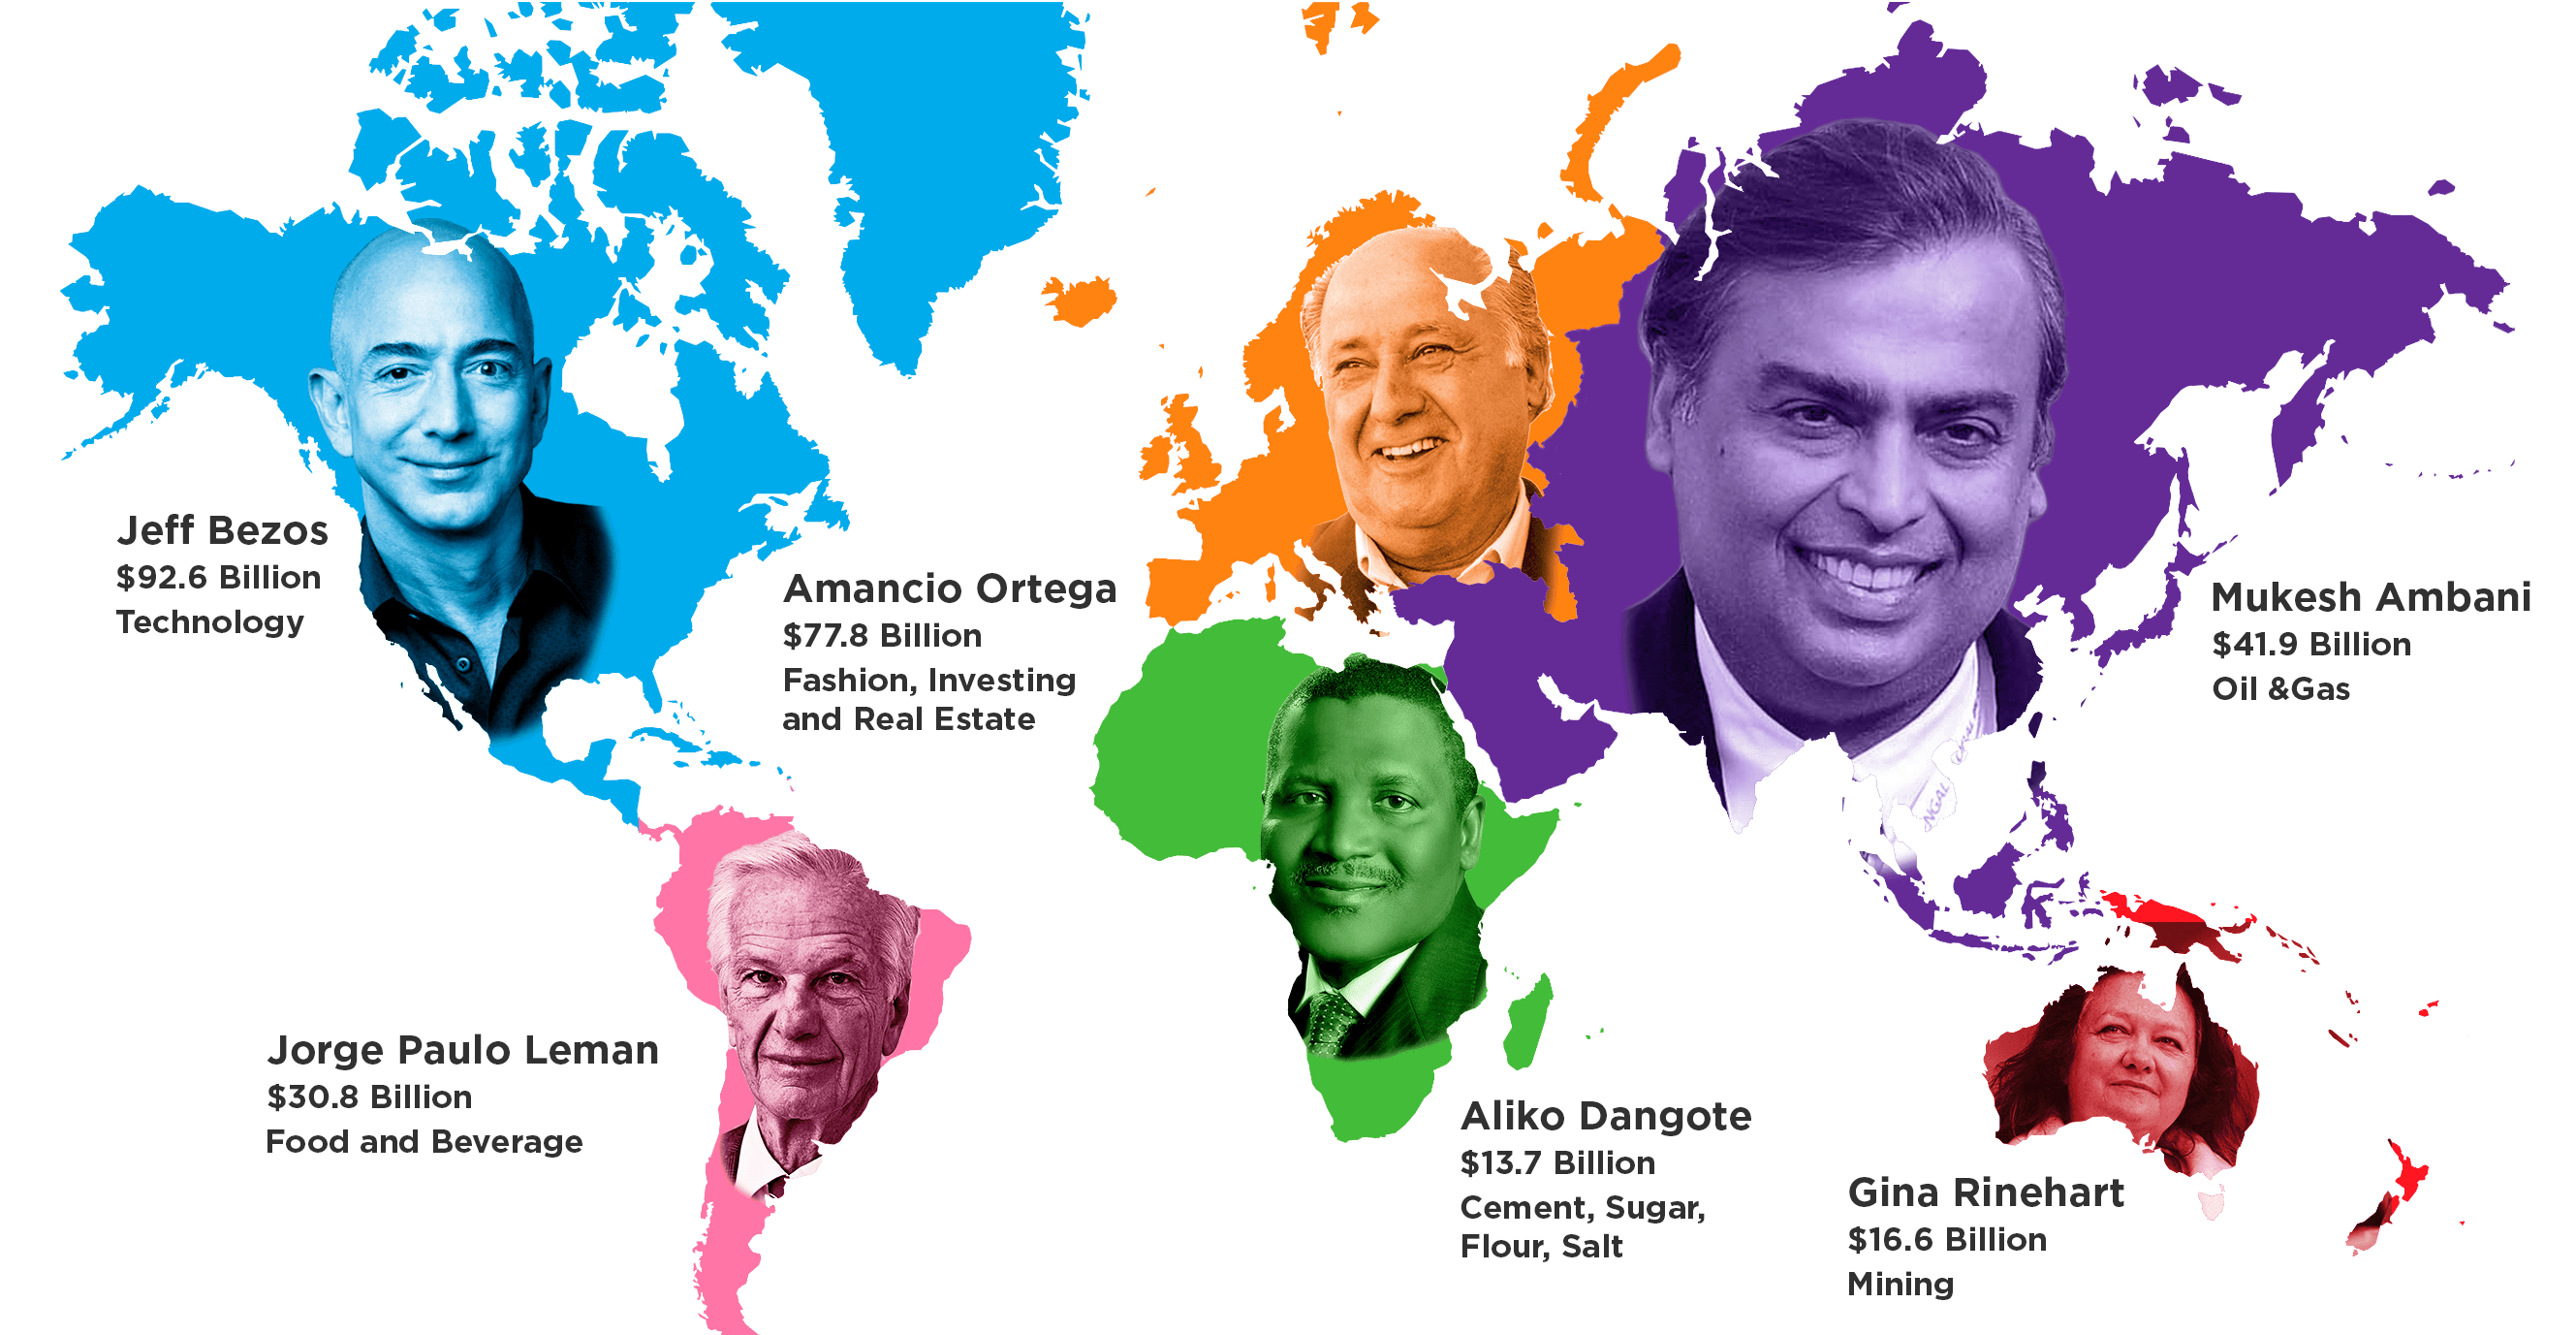
The net worth and source of wealth for the richest person on each continent. It includes Jeff Bezos, who is now the world's richest person overall.
This chart looks at some of the common items that are sold on the Dark Web, and how much they sold for on average in 2022.
It’s been a long year since the WHO declared the novel coronavirus a global pandemic. This visual looks at key events in the COVID-19 timeline.
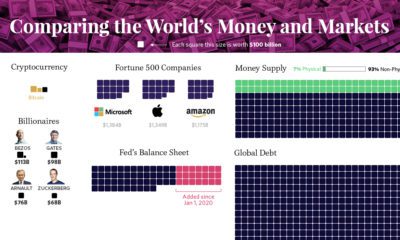
Our most famous visualization, updated for 2020 to show all global debt, wealth, money, and assets in one massive and mind-bending chart.
eSports has evolved into a billion dollar industry in just a decade, but how does it fare against traditional sports when it comes to monetization?
The Business of the 2014 World Cup As you are reading this, billions of people are enjoying and celebrating the beautiful game being played by the...


 Creator Program